U.S. Virgin Islander vs Immigrants from Croatia Single Female Poverty
COMPARE
U.S. Virgin Islander
Immigrants from Croatia
Single Female Poverty
Single Female Poverty Comparison
U.S. Virgin Islanders
Immigrants from Croatia
24.2%
SINGLE FEMALE POVERTY
0.0/ 100
METRIC RATING
289th/ 347
METRIC RANK
18.9%
SINGLE FEMALE POVERTY
99.9/ 100
METRIC RATING
44th/ 347
METRIC RANK
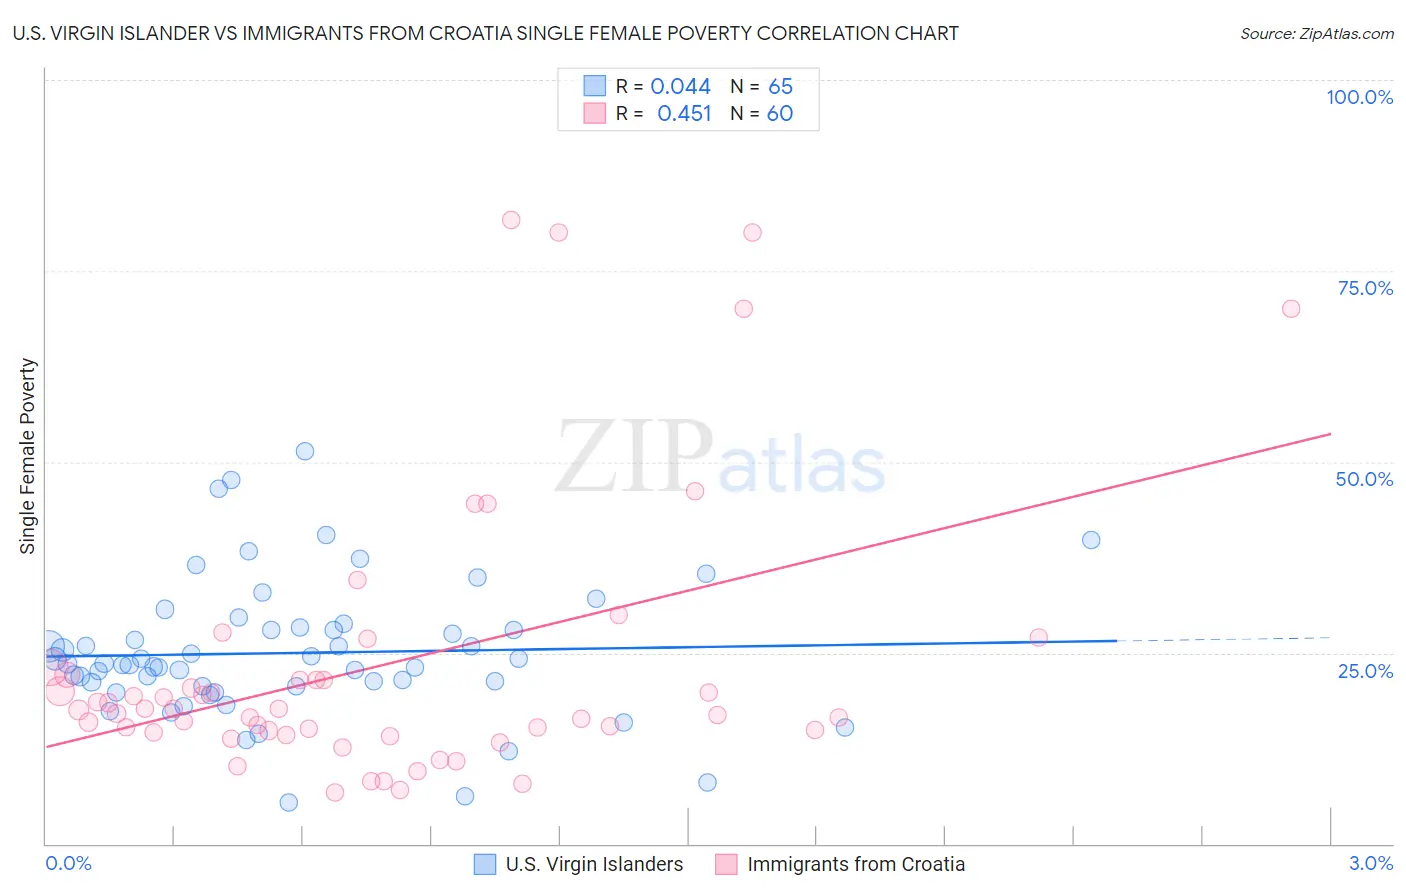
U.S. Virgin Islander vs Immigrants from Croatia Single Female Poverty Correlation Chart
The statistical analysis conducted on geographies consisting of 87,304,073 people shows no correlation between the proportion of U.S. Virgin Islanders and poverty level among single females in the United States with a correlation coefficient (R) of 0.044 and weighted average of 24.2%. Similarly, the statistical analysis conducted on geographies consisting of 131,494,560 people shows a moderate positive correlation between the proportion of Immigrants from Croatia and poverty level among single females in the United States with a correlation coefficient (R) of 0.451 and weighted average of 18.9%, a difference of 28.1%.
Single Female Poverty Correlation Summary
| Measurement | U.S. Virgin Islander | Immigrants from Croatia |
| Minimum | 5.4% | 6.7% |
| Maximum | 51.4% | 81.7% |
| Range | 46.0% | 74.9% |
| Mean | 25.0% | 23.4% |
| Median | 23.5% | 17.6% |
| Interquartile 25% (IQ1) | 20.7% | 14.7% |
| Interquartile 75% (IQ3) | 28.2% | 21.8% |
| Interquartile Range (IQR) | 7.5% | 7.1% |
| Standard Deviation (Sample) | 8.9% | 18.1% |
| Standard Deviation (Population) | 8.9% | 18.0% |
Similar Demographics by Single Female Poverty
Demographics Similar to U.S. Virgin Islanders by Single Female Poverty
In terms of single female poverty, the demographic groups most similar to U.S. Virgin Islanders are Spanish American (24.2%, a difference of 0.050%), Bangladeshi (24.2%, a difference of 0.070%), Cree (24.1%, a difference of 0.22%), Immigrants from Guatemala (24.1%, a difference of 0.26%), and Indonesian (24.3%, a difference of 0.34%).
| Demographics | Rating | Rank | Single Female Poverty |
| Guatemalans | 0.0 /100 | #282 | Tragic 23.8% |
| German Russians | 0.0 /100 | #283 | Tragic 23.9% |
| Immigrants | Dominica | 0.0 /100 | #284 | Tragic 23.9% |
| Immigrants | Guatemala | 0.0 /100 | #285 | Tragic 24.1% |
| Cree | 0.0 /100 | #286 | Tragic 24.1% |
| Bangladeshis | 0.0 /100 | #287 | Tragic 24.2% |
| Spanish Americans | 0.0 /100 | #288 | Tragic 24.2% |
| U.S. Virgin Islanders | 0.0 /100 | #289 | Tragic 24.2% |
| Indonesians | 0.0 /100 | #290 | Tragic 24.3% |
| Osage | 0.0 /100 | #291 | Tragic 24.4% |
| Alsatians | 0.0 /100 | #292 | Tragic 24.5% |
| Americans | 0.0 /100 | #293 | Tragic 24.5% |
| French American Indians | 0.0 /100 | #294 | Tragic 24.6% |
| Hispanics or Latinos | 0.0 /100 | #295 | Tragic 24.6% |
| Africans | 0.0 /100 | #296 | Tragic 24.8% |
Demographics Similar to Immigrants from Croatia by Single Female Poverty
In terms of single female poverty, the demographic groups most similar to Immigrants from Croatia are Immigrants from Romania (18.8%, a difference of 0.17%), Immigrants from Indonesia (18.9%, a difference of 0.21%), Jordanian (18.8%, a difference of 0.32%), Macedonian (18.9%, a difference of 0.38%), and Immigrants from Serbia (18.8%, a difference of 0.40%).
| Demographics | Rating | Rank | Single Female Poverty |
| Immigrants | Armenia | 99.9 /100 | #37 | Exceptional 18.7% |
| Tongans | 99.9 /100 | #38 | Exceptional 18.8% |
| Bulgarians | 99.9 /100 | #39 | Exceptional 18.8% |
| Okinawans | 99.9 /100 | #40 | Exceptional 18.8% |
| Immigrants | Serbia | 99.9 /100 | #41 | Exceptional 18.8% |
| Jordanians | 99.9 /100 | #42 | Exceptional 18.8% |
| Immigrants | Romania | 99.9 /100 | #43 | Exceptional 18.8% |
| Immigrants | Croatia | 99.9 /100 | #44 | Exceptional 18.9% |
| Immigrants | Indonesia | 99.8 /100 | #45 | Exceptional 18.9% |
| Macedonians | 99.8 /100 | #46 | Exceptional 18.9% |
| Latvians | 99.8 /100 | #47 | Exceptional 19.0% |
| Immigrants | Argentina | 99.8 /100 | #48 | Exceptional 19.0% |
| Immigrants | Czechoslovakia | 99.8 /100 | #49 | Exceptional 19.0% |
| Immigrants | Eastern Europe | 99.8 /100 | #50 | Exceptional 19.0% |
| Immigrants | Italy | 99.8 /100 | #51 | Exceptional 19.0% |