Ukrainian vs Immigrants from Norway Family Poverty
COMPARE
Ukrainian
Immigrants from Norway
Family Poverty
Family Poverty Comparison
Ukrainians
Immigrants from Norway
7.9%
FAMILY POVERTY
98.0/ 100
METRIC RATING
77th/ 347
METRIC RANK
8.1%
FAMILY POVERTY
95.7/ 100
METRIC RATING
101st/ 347
METRIC RANK
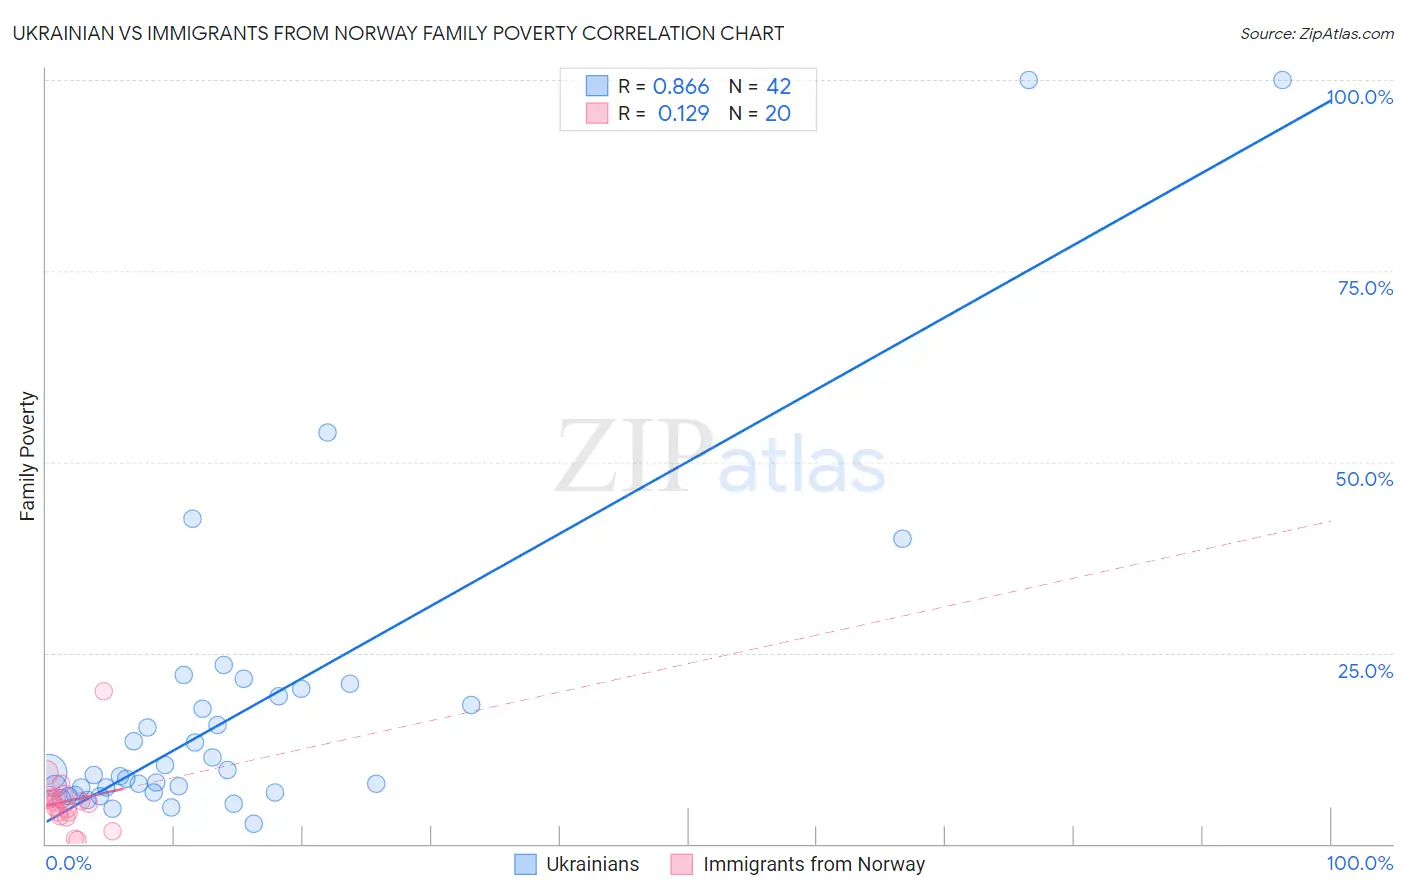
Ukrainian vs Immigrants from Norway Family Poverty Correlation Chart
The statistical analysis conducted on geographies consisting of 446,514,525 people shows a very strong positive correlation between the proportion of Ukrainians and poverty level among families in the United States with a correlation coefficient (R) of 0.866 and weighted average of 7.9%. Similarly, the statistical analysis conducted on geographies consisting of 116,627,868 people shows a poor positive correlation between the proportion of Immigrants from Norway and poverty level among families in the United States with a correlation coefficient (R) of 0.129 and weighted average of 8.1%, a difference of 2.8%.
Family Poverty Correlation Summary
| Measurement | Ukrainian | Immigrants from Norway |
| Minimum | 2.6% | 0.43% |
| Maximum | 100.0% | 20.0% |
| Range | 97.4% | 19.6% |
| Mean | 17.6% | 5.6% |
| Median | 9.2% | 5.3% |
| Interquartile 25% (IQ1) | 6.8% | 3.9% |
| Interquartile 75% (IQ3) | 19.3% | 6.2% |
| Interquartile Range (IQR) | 12.5% | 2.3% |
| Standard Deviation (Sample) | 21.5% | 4.0% |
| Standard Deviation (Population) | 21.2% | 3.9% |
Similar Demographics by Family Poverty
Demographics Similar to Ukrainians by Family Poverty
In terms of family poverty, the demographic groups most similar to Ukrainians are Immigrants from Latvia (7.9%, a difference of 0.010%), Immigrants from North America (7.9%, a difference of 0.12%), Immigrants from Europe (7.9%, a difference of 0.19%), Immigrants from Croatia (7.8%, a difference of 0.24%), and English (7.9%, a difference of 0.25%).
| Demographics | Rating | Rank | Family Poverty |
| Immigrants | Canada | 98.2 /100 | #70 | Exceptional 7.8% |
| Cambodians | 98.2 /100 | #71 | Exceptional 7.8% |
| Immigrants | Romania | 98.2 /100 | #72 | Exceptional 7.8% |
| Austrians | 98.2 /100 | #73 | Exceptional 7.8% |
| Immigrants | China | 98.1 /100 | #74 | Exceptional 7.8% |
| Immigrants | Croatia | 98.1 /100 | #75 | Exceptional 7.8% |
| Immigrants | Latvia | 98.0 /100 | #76 | Exceptional 7.9% |
| Ukrainians | 98.0 /100 | #77 | Exceptional 7.9% |
| Immigrants | North America | 97.9 /100 | #78 | Exceptional 7.9% |
| Immigrants | Europe | 97.8 /100 | #79 | Exceptional 7.9% |
| English | 97.8 /100 | #80 | Exceptional 7.9% |
| Irish | 97.8 /100 | #81 | Exceptional 7.9% |
| Immigrants | Poland | 97.8 /100 | #82 | Exceptional 7.9% |
| Slovaks | 97.7 /100 | #83 | Exceptional 7.9% |
| British | 97.5 /100 | #84 | Exceptional 7.9% |
Demographics Similar to Immigrants from Norway by Family Poverty
In terms of family poverty, the demographic groups most similar to Immigrants from Norway are Immigrants from Indonesia (8.1%, a difference of 0.010%), New Zealander (8.1%, a difference of 0.030%), Welsh (8.1%, a difference of 0.10%), Immigrants from Eastern Europe (8.1%, a difference of 0.10%), and Slavic (8.1%, a difference of 0.11%).
| Demographics | Rating | Rank | Family Poverty |
| Immigrants | Pakistan | 96.6 /100 | #94 | Exceptional 8.0% |
| Immigrants | Philippines | 96.5 /100 | #95 | Exceptional 8.0% |
| Immigrants | Turkey | 96.5 /100 | #96 | Exceptional 8.0% |
| Immigrants | Switzerland | 96.1 /100 | #97 | Exceptional 8.1% |
| Immigrants | South Africa | 95.9 /100 | #98 | Exceptional 8.1% |
| Welsh | 95.8 /100 | #99 | Exceptional 8.1% |
| New Zealanders | 95.8 /100 | #100 | Exceptional 8.1% |
| Immigrants | Norway | 95.7 /100 | #101 | Exceptional 8.1% |
| Immigrants | Indonesia | 95.7 /100 | #102 | Exceptional 8.1% |
| Immigrants | Eastern Europe | 95.6 /100 | #103 | Exceptional 8.1% |
| Slavs | 95.6 /100 | #104 | Exceptional 8.1% |
| Laotians | 95.6 /100 | #105 | Exceptional 8.1% |
| Egyptians | 95.1 /100 | #106 | Exceptional 8.1% |
| French Canadians | 95.0 /100 | #107 | Exceptional 8.1% |
| Basques | 94.9 /100 | #108 | Exceptional 8.1% |