Ukrainian vs Immigrants from Netherlands Receiving Food Stamps
COMPARE
Ukrainian
Immigrants from Netherlands
Receiving Food Stamps
Receiving Food Stamps Comparison
Ukrainians
Immigrants from Netherlands
10.7%
RECEIVING FOOD STAMPS
92.8/ 100
METRIC RATING
125th/ 347
METRIC RANK
9.5%
RECEIVING FOOD STAMPS
99.5/ 100
METRIC RATING
40th/ 347
METRIC RANK
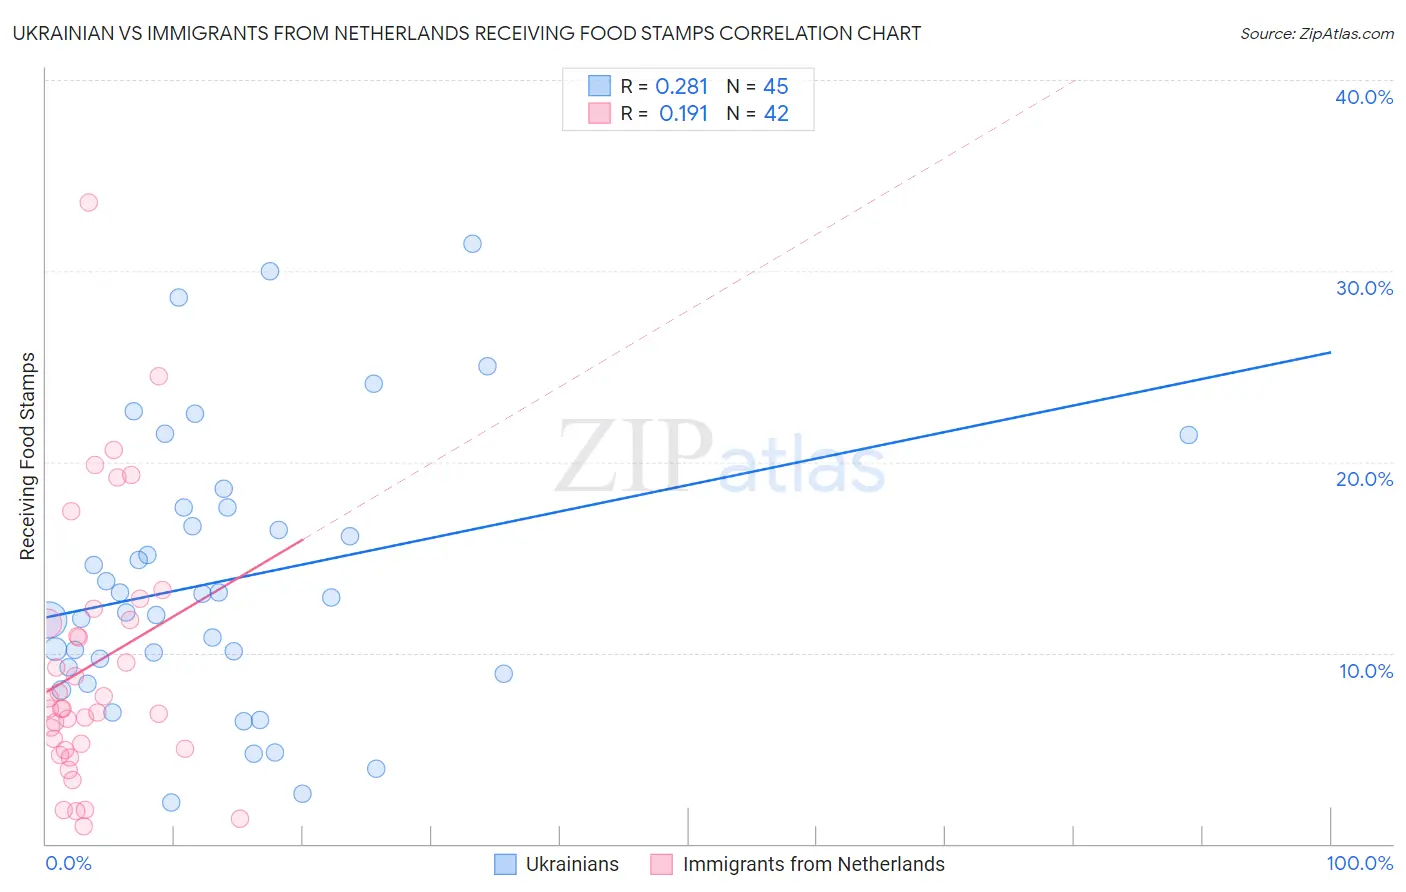
Ukrainian vs Immigrants from Netherlands Receiving Food Stamps Correlation Chart
The statistical analysis conducted on geographies consisting of 446,698,420 people shows a weak positive correlation between the proportion of Ukrainians and percentage of population receiving government assistance and/or food stamps in the United States with a correlation coefficient (R) of 0.281 and weighted average of 10.7%. Similarly, the statistical analysis conducted on geographies consisting of 237,448,822 people shows a poor positive correlation between the proportion of Immigrants from Netherlands and percentage of population receiving government assistance and/or food stamps in the United States with a correlation coefficient (R) of 0.191 and weighted average of 9.5%, a difference of 12.2%.
Receiving Food Stamps Correlation Summary
| Measurement | Ukrainian | Immigrants from Netherlands |
| Minimum | 2.2% | 0.90% |
| Maximum | 31.4% | 33.6% |
| Range | 29.2% | 32.7% |
| Mean | 13.8% | 9.4% |
| Median | 12.9% | 7.1% |
| Interquartile 25% (IQ1) | 9.1% | 5.0% |
| Interquartile 75% (IQ3) | 17.6% | 11.7% |
| Interquartile Range (IQR) | 8.5% | 6.7% |
| Standard Deviation (Sample) | 7.2% | 6.9% |
| Standard Deviation (Population) | 7.1% | 6.8% |
Similar Demographics by Receiving Food Stamps
Demographics Similar to Ukrainians by Receiving Food Stamps
In terms of receiving food stamps, the demographic groups most similar to Ukrainians are Paraguayan (10.7%, a difference of 0.080%), Afghan (10.7%, a difference of 0.14%), Immigrants from Ethiopia (10.7%, a difference of 0.16%), Immigrants from Jordan (10.7%, a difference of 0.17%), and Yugoslavian (10.7%, a difference of 0.17%).
| Demographics | Rating | Rank | Receiving Food Stamps |
| Assyrians/Chaldeans/Syriacs | 94.1 /100 | #118 | Exceptional 10.6% |
| Immigrants | Poland | 93.9 /100 | #119 | Exceptional 10.6% |
| Ethiopians | 93.9 /100 | #120 | Exceptional 10.6% |
| Slavs | 93.8 /100 | #121 | Exceptional 10.6% |
| Sri Lankans | 93.7 /100 | #122 | Exceptional 10.6% |
| Immigrants | Philippines | 93.3 /100 | #123 | Exceptional 10.7% |
| Paraguayans | 93.0 /100 | #124 | Exceptional 10.7% |
| Ukrainians | 92.8 /100 | #125 | Exceptional 10.7% |
| Afghans | 92.6 /100 | #126 | Exceptional 10.7% |
| Immigrants | Ethiopia | 92.6 /100 | #127 | Exceptional 10.7% |
| Immigrants | Jordan | 92.5 /100 | #128 | Exceptional 10.7% |
| Yugoslavians | 92.5 /100 | #129 | Exceptional 10.7% |
| Israelis | 92.4 /100 | #130 | Exceptional 10.7% |
| French | 92.3 /100 | #131 | Exceptional 10.7% |
| Immigrants | Germany | 92.0 /100 | #132 | Exceptional 10.7% |
Demographics Similar to Immigrants from Netherlands by Receiving Food Stamps
In terms of receiving food stamps, the demographic groups most similar to Immigrants from Netherlands are Immigrants from Bolivia (9.5%, a difference of 0.010%), Immigrants from Sri Lanka (9.5%, a difference of 0.020%), Cambodian (9.5%, a difference of 0.17%), European (9.5%, a difference of 0.31%), and Estonian (9.5%, a difference of 0.37%).
| Demographics | Rating | Rank | Receiving Food Stamps |
| Zimbabweans | 99.6 /100 | #33 | Exceptional 9.5% |
| Turks | 99.6 /100 | #34 | Exceptional 9.5% |
| Immigrants | Austria | 99.6 /100 | #35 | Exceptional 9.5% |
| Estonians | 99.6 /100 | #36 | Exceptional 9.5% |
| Europeans | 99.6 /100 | #37 | Exceptional 9.5% |
| Immigrants | Sri Lanka | 99.5 /100 | #38 | Exceptional 9.5% |
| Immigrants | Bolivia | 99.5 /100 | #39 | Exceptional 9.5% |
| Immigrants | Netherlands | 99.5 /100 | #40 | Exceptional 9.5% |
| Cambodians | 99.5 /100 | #41 | Exceptional 9.5% |
| Immigrants | China | 99.5 /100 | #42 | Exceptional 9.6% |
| Croatians | 99.5 /100 | #43 | Exceptional 9.6% |
| Immigrants | Denmark | 99.4 /100 | #44 | Exceptional 9.6% |
| Immigrants | Belgium | 99.4 /100 | #45 | Exceptional 9.6% |
| Australians | 99.4 /100 | #46 | Exceptional 9.6% |
| Indians (Asian) | 99.4 /100 | #47 | Exceptional 9.6% |