Ukrainian vs Immigrants from Dominican Republic Seniors Poverty Over the Age of 65

COMPARE

Ukrainian
Race
Ancestry
AfghanAfricanAlaska NativeAlaskan AthabascanAlbanianAleutAlsatianAmericanApacheArabArapahoArgentineanArmenianAssyrian/Chaldean/SyriacAustralianAustrianBahamianBangladeshiBarbadianBasqueBelgianBelizeanBermudanBhutaneseBlackfeetBolivianBrazilianBritishBritish West IndianBulgarianBurmeseCajunCambodianCanadianCape VerdeanCarpatho RusynCelticCentral AmericanCentral American IndianCherokeeCheyenneChickasawChileanChineseChippewaChoctawColombianColvilleComancheCosta RicanCreeCreekCroatianCrowCubanCypriotCzechCzechoslovakianDanishDelawareDominicanDutchDutch West IndianEastern EuropeanEcuadorianEgyptianEnglishEstonianEthiopianEuropeanFijianFilipinoFinnishFrenchFrench American IndianFrench CanadianGermanGerman RussianGhanaianGreekGuamanian/ChamorroGuatemalanGuyaneseHaitianHmongHonduranHopiHoumaHungarianIcelanderIndian (Asian)IndonesianInupiatIranianIraqiIrishIroquoisIsraeliItalianJamaicanJapaneseJordanianKenyanKiowaKoreanLaotianLatvianLebaneseLiberianLithuanianLumbeeLuxembourgerMacedonianMalaysianMalteseMarshalleseMenomineeMexicanMexican American IndianMongolianMoroccanNative HawaiianNavajoNepaleseNew ZealanderNicaraguanNigerianNorthern EuropeanNorwegianOkinawanOsageOttawaPaiutePakistaniPalestinianPanamanianParaguayanPennsylvania GermanPeruvianPimaPolishPortuguesePotawatomiPuebloPuerto RicanPuget Sound SalishRomanianRussianSalvadoranSamoanScandinavianScotch-IrishScottishSeminoleSenegaleseSerbianShoshoneSierra LeoneanSiouxSlavicSlovakSloveneSomaliSouth AfricanSouth AmericanSouth American IndianSoviet UnionSpaniardSpanishSpanish AmericanSpanish American IndianSri LankanSubsaharan AfricanSudaneseSwedishSwissSyrianTaiwaneseThaiTlingit-HaidaTohono O'OdhamTonganTrinidadian and TobagonianTsimshianTurkishU.S. Virgin IslanderUgandanUkrainianUruguayanUteVenezuelanVietnameseWelshWest IndianYakamaYaquiYugoslavianYumanYup'ikZimbabwean
Immigration
NonimmigrantsImmigrantsAfghanistanAfricaAlbaniaArgentinaArmeniaAsiaAustraliaAustriaBahamasBangladeshBarbadosBelarusBelgiumBelizeBoliviaBosnia and HerzegovinaBrazilBulgariaBurma/MyanmarCabo VerdeCambodiaCameroonCanadaCaribbeanCentral AmericaChileChinaColombiaCongoCosta RicaCroatiaCubaCzechoslovakiaDenmarkDominicaEastern AfricaEastern AsiaEastern EuropeEcuadorEgyptEl SalvadorEnglandEritreaEthiopiaEuropeFijiFranceGermanyGhanaGreeceGrenadaGuatemalaGuyanaHaitiHondurasHong KongHungaryIndiaIndonesiaIranIraqIrelandIsraelItalyJamaicaJapanJordanKazakhstanKenyaKoreaKuwaitLaosLatin AmericaLatviaLebanonLiberiaLithuaniaMalaysiaMexicoMicronesiaMiddle AfricaMoldovaMoroccoNepalNetherlandsNicaraguaNigeriaNorth AmericaNorth MacedoniaNorthern AfricaNorthern EuropeNorwayOceaniaPakistanPanamaPeruPhilippinesPolandPortugalRomaniaRussiaSaudi ArabiaScotlandSenegalSerbiaSierra LeoneSingaporeSomaliaSouth AfricaSouth AmericaSouth Central AsiaSouth Eastern AsiaSouthern EuropeSpainSri LankaSt. Vincent and the GrenadinesSudanSwedenSwitzerlandSyriaTaiwanThailandTrinidad and TobagoTurkeyUgandaUkraineUruguayUzbekistanVenezuelaVietnamWest IndiesWestern AfricaWestern AsiaWestern EuropeYemenZaireZimbabweAzores
Immigrants from Dominican Republic
Race
Ancestry
AfghanAfricanAlaska NativeAlaskan AthabascanAlbanianAleutAlsatianAmericanApacheArabArapahoArgentineanArmenianAssyrian/Chaldean/SyriacAustralianAustrianBahamianBangladeshiBarbadianBasqueBelgianBelizeanBermudanBhutaneseBlackfeetBolivianBrazilianBritishBritish West IndianBulgarianBurmeseCajunCambodianCanadianCape VerdeanCarpatho RusynCelticCentral AmericanCentral American IndianCherokeeCheyenneChickasawChileanChineseChippewaChoctawColombianColvilleComancheCosta RicanCreeCreekCroatianCrowCubanCypriotCzechCzechoslovakianDanishDelawareDominicanDutchDutch West IndianEastern EuropeanEcuadorianEgyptianEnglishEstonianEthiopianEuropeanFijianFilipinoFinnishFrenchFrench American IndianFrench CanadianGermanGerman RussianGhanaianGreekGuamanian/ChamorroGuatemalanGuyaneseHaitianHmongHonduranHopiHoumaHungarianIcelanderIndian (Asian)IndonesianInupiatIranianIraqiIrishIroquoisIsraeliItalianJamaicanJapaneseJordanianKenyanKiowaKoreanLaotianLatvianLebaneseLiberianLithuanianLumbeeLuxembourgerMacedonianMalaysianMalteseMarshalleseMenomineeMexicanMexican American IndianMongolianMoroccanNative HawaiianNavajoNepaleseNew ZealanderNicaraguanNigerianNorthern EuropeanNorwegianOkinawanOsageOttawaPaiutePakistaniPalestinianPanamanianParaguayanPennsylvania GermanPeruvianPimaPolishPortuguesePotawatomiPuebloPuerto RicanPuget Sound SalishRomanianRussianSalvadoranSamoanScandinavianScotch-IrishScottishSeminoleSenegaleseSerbianShoshoneSierra LeoneanSiouxSlavicSlovakSloveneSomaliSouth AfricanSouth AmericanSouth American IndianSoviet UnionSpaniardSpanishSpanish AmericanSpanish American IndianSri LankanSubsaharan AfricanSudaneseSwedishSwissSyrianTaiwaneseThaiTlingit-HaidaTohono O'OdhamTonganTrinidadian and TobagonianTsimshianTurkishU.S. Virgin IslanderUgandanUruguayanUteVenezuelanVietnameseWelshWest IndianYakamaYaquiYugoslavianYumanYup'ikZimbabwean
Immigration
NonimmigrantsImmigrantsAfghanistanAfricaAlbaniaArgentinaArmeniaAsiaAustraliaAustriaBahamasBangladeshBarbadosBelarusBelgiumBelizeBoliviaBosnia and HerzegovinaBrazilBulgariaBurma/MyanmarCabo VerdeCambodiaCameroonCanadaCaribbeanCentral AmericaChileChinaColombiaCongoCosta RicaCroatiaCubaCzechoslovakiaDenmarkDominicaDominican RepublicEastern AfricaEastern AsiaEastern EuropeEcuadorEgyptEl SalvadorEnglandEritreaEthiopiaEuropeFijiFranceGermanyGhanaGreeceGrenadaGuatemalaGuyanaHaitiHondurasHong KongHungaryIndiaIndonesiaIranIraqIrelandIsraelItalyJamaicaJapanJordanKazakhstanKenyaKoreaKuwaitLaosLatin AmericaLatviaLebanonLiberiaLithuaniaMalaysiaMexicoMicronesiaMiddle AfricaMoldovaMoroccoNepalNetherlandsNicaraguaNigeriaNorth AmericaNorth MacedoniaNorthern AfricaNorthern EuropeNorwayOceaniaPakistanPanamaPeruPhilippinesPolandPortugalRomaniaRussiaSaudi ArabiaScotlandSenegalSerbiaSierra LeoneSingaporeSomaliaSouth AfricaSouth AmericaSouth Central AsiaSouth Eastern AsiaSouthern EuropeSpainSri LankaSt. Vincent and the GrenadinesSudanSwedenSwitzerlandSyriaTaiwanThailandTrinidad and TobagoTurkeyUgandaUkraineUruguayUzbekistanVenezuelaVietnamWest IndiesWestern AfricaWestern AsiaWestern EuropeYemenZaireZimbabweAzores
Seniors Poverty Over the Age of 65
Income
Poverty
Unemployment
Labor Participation
Family Structure
Vehicle Availability
Education Level
Disability

Seniors Poverty Over the Age of 65 Comparison

Ukrainians

Immigrants from Dominican Republic

Exceptional
Tragic
10.1%
SENIORS POVERTY OVER THE AGE OF 65
96.9/ 100
METRIC RATING
90th/ 347
METRIC RANK
18.3%
SENIORS POVERTY OVER THE AGE OF 65
0.0/ 100
METRIC RATING
344th/ 347
METRIC RANK

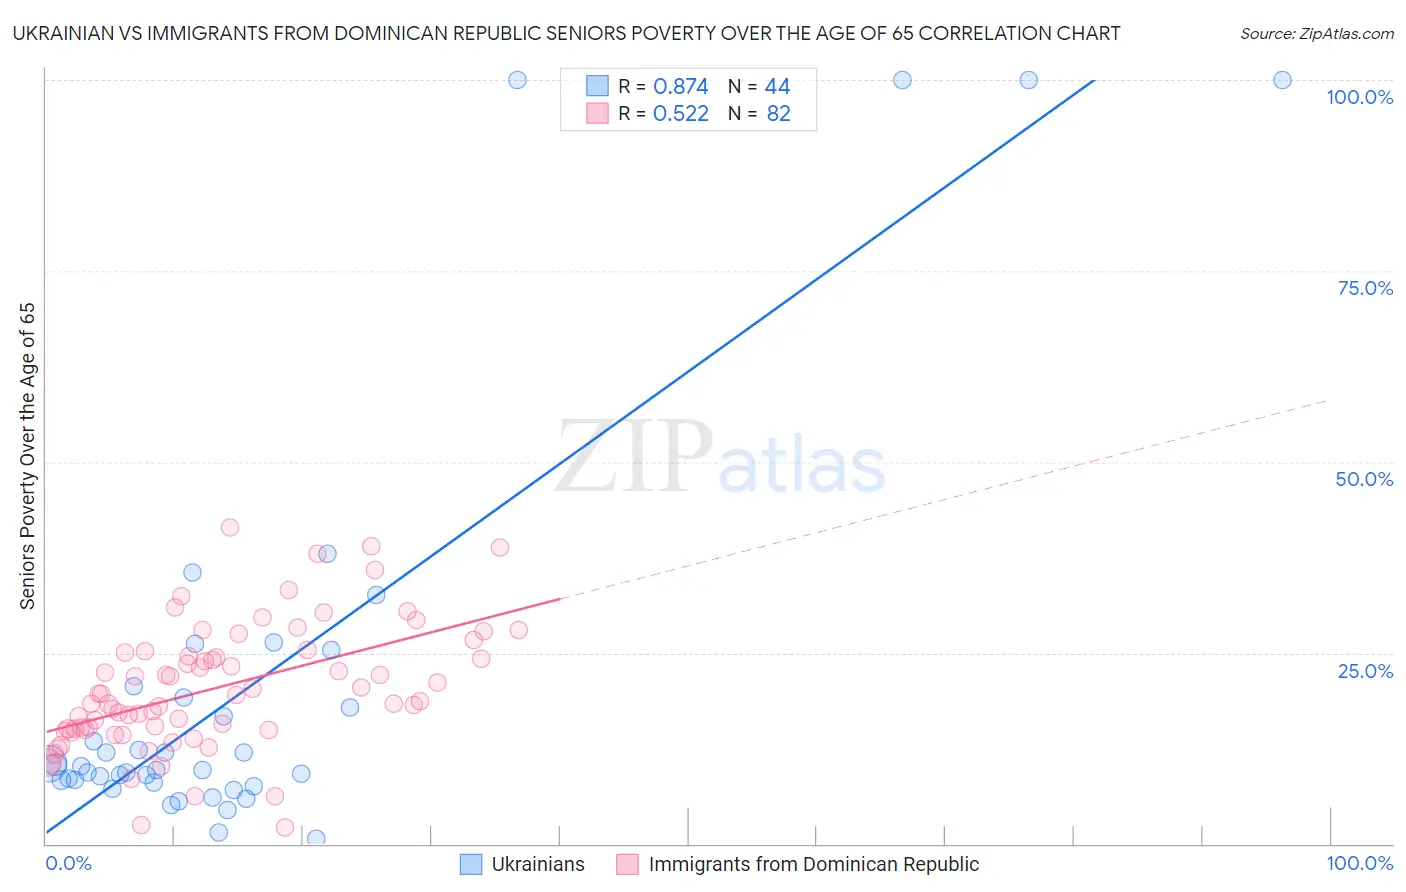
Ukrainian vs Immigrants from Dominican Republic Seniors Poverty Over the Age of 65 Correlation Chart

The statistical analysis conducted on geographies consisting of 446,354,944 people shows a very strong positive correlation between the proportion of Ukrainians and poverty level among seniors over the age of 65 in the United States with a correlation coefficient (R) of 0.874 and weighted average of 10.1%. Similarly, the statistical analysis conducted on geographies consisting of 274,160,985 people shows a substantial positive correlation between the proportion of Immigrants from Dominican Republic and poverty level among seniors over the age of 65 in the United States with a correlation coefficient (R) of 0.522 and weighted average of 18.3%, a difference of 81.2%.
Ukrainian vs Immigrants from Dominican Republic Seniors Poverty Over the Age of 65

Seniors Poverty Over the Age of 65 Correlation Summary

MeasurementUkrainianImmigrants from Dominican Republic
Minimum0.61%2.2%
Maximum100.0%41.4%
Range99.4%39.2%
Mean20.7%20.3%
Median9.9%19.1%
Interquartile 25% (IQ1)8.2%14.9%
Interquartile 75% (IQ3)19.9%25.1%
Interquartile Range (IQR)11.7%10.2%
Standard Deviation (Sample)26.7%8.1%
Standard Deviation (Population)26.4%8.1%

Similar Demographics by Seniors Poverty Over the Age of 65

Demographics Similar to Ukrainians by Seniors Poverty Over the Age of 65

In terms of seniors poverty over the age of 65, the demographic groups most similar to Ukrainians are Puget Sound Salish (10.1%, a difference of 0.020%), Immigrants from Singapore (10.1%, a difference of 0.040%), Immigrants from Bulgaria (10.1%, a difference of 0.060%), Jordanian (10.1%, a difference of 0.14%), and Immigrants from Sweden (10.1%, a difference of 0.15%).
DemographicsRating | RankSeniors Poverty Over the Age of 65
Immigrants | Poland
97.2
/100
|
#83
Exceptional
10.1%
Immigrants | Afghanistan
97.2
/100
|
#84
Exceptional
10.1%
Immigrants | Nepal
97.2
/100
|
#85
Exceptional
10.1%
Romanians
97.2
/100
|
#86
Exceptional
10.1%
Burmese
97.2
/100
|
#87
Exceptional
10.1%
Jordanians
97.1
/100
|
#88
Exceptional
10.1%
Immigrants | Bulgaria
97.0
/100
|
#89
Exceptional
10.1%
Ukrainians
96.9
/100
|
#90
Exceptional
10.1%
Puget Sound Salish
96.9
/100
|
#91
Exceptional
10.1%
Immigrants | Singapore
96.9
/100
|
#92
Exceptional
10.1%
Immigrants | Sweden
96.7
/100
|
#93
Exceptional
10.1%
Immigrants | Germany
96.7
/100
|
#94
Exceptional
10.1%
Immigrants | Japan
96.3
/100
|
#95
Exceptional
10.1%
Basques
95.9
/100
|
#96
Exceptional
10.2%
Immigrants | Pakistan
95.7
/100
|
#97
Exceptional
10.2%

Demographics Similar to Immigrants from Dominican Republic by Seniors Poverty Over the Age of 65

In terms of seniors poverty over the age of 65, the demographic groups most similar to Immigrants from Dominican Republic are Lumbee (18.1%, a difference of 0.90%), Immigrants from Cuba (17.9%, a difference of 2.0%), Dominican (17.8%, a difference of 2.5%), Hopi (17.8%, a difference of 2.9%), and Navajo (17.5%, a difference of 4.8%).
DemographicsRating | RankSeniors Poverty Over the Age of 65
Immigrants | Yemen
0.0
/100
|
#333
Tragic
15.9%
Immigrants | Nicaragua
0.0
/100
|
#334
Tragic
15.9%
Cubans
0.0
/100
|
#335
Tragic
16.1%
Immigrants | Cabo Verde
0.0
/100
|
#336
Tragic
16.2%
Immigrants | Caribbean
0.0
/100
|
#337
Tragic
16.5%
Pueblo
0.0
/100
|
#338
Tragic
17.2%
Navajo
0.0
/100
|
#339
Tragic
17.5%
Hopi
0.0
/100
|
#340
Tragic
17.8%
Dominicans
0.0
/100
|
#341
Tragic
17.8%
Immigrants | Cuba
0.0
/100
|
#342
Tragic
17.9%
Lumbee
0.0
/100
|
#343
Tragic
18.1%
Immigrants | Dominican Republic
0.0
/100
|
#344
Tragic
18.3%
Pima
0.0
/100
|
#345
Tragic
19.8%
Tohono O'odham
0.0
/100
|
#346
Tragic
20.8%
Puerto Ricans
0.0
/100
|
#347
Tragic
21.4%