Ugandan vs Immigrants from Portugal Child Poverty Among Girls Under 16
COMPARE
Ugandan
Immigrants from Portugal
Child Poverty Among Girls Under 16
Child Poverty Among Girls Under 16 Comparison
Ugandans
Immigrants from Portugal
17.2%
CHILD POVERTY AMONG GIRLS UNDER 16
17.5/ 100
METRIC RATING
203rd/ 347
METRIC RANK
16.6%
CHILD POVERTY AMONG GIRLS UNDER 16
42.5/ 100
METRIC RATING
183rd/ 347
METRIC RANK
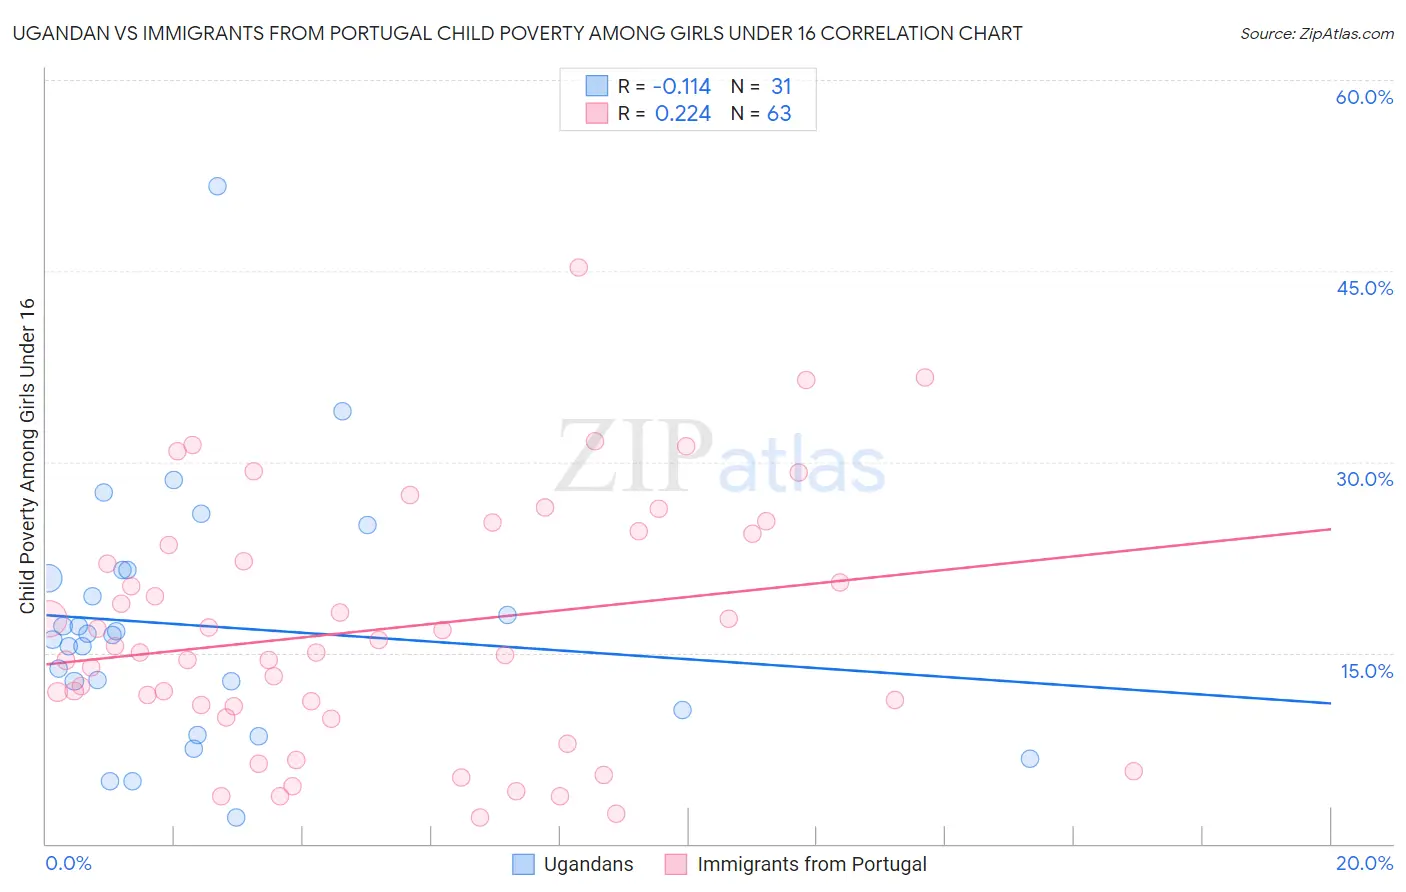
Ugandan vs Immigrants from Portugal Child Poverty Among Girls Under 16 Correlation Chart
The statistical analysis conducted on geographies consisting of 93,523,032 people shows a poor negative correlation between the proportion of Ugandans and poverty level among girls under the age of 16 in the United States with a correlation coefficient (R) of -0.114 and weighted average of 17.2%. Similarly, the statistical analysis conducted on geographies consisting of 172,155,707 people shows a weak positive correlation between the proportion of Immigrants from Portugal and poverty level among girls under the age of 16 in the United States with a correlation coefficient (R) of 0.224 and weighted average of 16.6%, a difference of 3.5%.
Child Poverty Among Girls Under 16 Correlation Summary
| Measurement | Ugandan | Immigrants from Portugal |
| Minimum | 2.1% | 2.0% |
| Maximum | 51.6% | 45.2% |
| Range | 49.5% | 43.2% |
| Mean | 17.1% | 16.9% |
| Median | 16.4% | 15.0% |
| Interquartile 25% (IQ1) | 10.5% | 10.8% |
| Interquartile 75% (IQ3) | 21.5% | 24.3% |
| Interquartile Range (IQR) | 10.9% | 13.5% |
| Standard Deviation (Sample) | 9.8% | 9.6% |
| Standard Deviation (Population) | 9.7% | 9.6% |
Demographics Similar to Ugandans and Immigrants from Portugal by Child Poverty Among Girls Under 16
In terms of child poverty among girls under 16, the demographic groups most similar to Ugandans are Immigrants from Sierra Leone (17.2%, a difference of 0.010%), Immigrants from Kenya (17.2%, a difference of 0.060%), Immigrants from Uzbekistan (17.1%, a difference of 0.70%), Immigrants from Afghanistan (17.1%, a difference of 0.85%), and Immigrants from Lebanon (17.1%, a difference of 0.88%). Similarly, the demographic groups most similar to Immigrants from Portugal are Scotch-Irish (16.7%, a difference of 0.34%), Immigrants from Uruguay (16.7%, a difference of 0.82%), South American Indian (16.8%, a difference of 0.90%), Immigrants from Morocco (16.8%, a difference of 0.95%), and Arab (16.8%, a difference of 0.96%).
| Demographics | Rating | Rank | Child Poverty Among Girls Under 16 |
| Immigrants | Portugal | 42.5 /100 | #183 | Average 16.6% |
| Scotch-Irish | 39.6 /100 | #184 | Fair 16.7% |
| Immigrants | Uruguay | 35.6 /100 | #185 | Fair 16.7% |
| South American Indians | 35.0 /100 | #186 | Fair 16.8% |
| Immigrants | Morocco | 34.6 /100 | #187 | Fair 16.8% |
| Arabs | 34.5 /100 | #188 | Fair 16.8% |
| Immigrants | Bosnia and Herzegovina | 32.5 /100 | #189 | Fair 16.8% |
| Kenyans | 32.3 /100 | #190 | Fair 16.8% |
| Immigrants | Azores | 31.3 /100 | #191 | Fair 16.8% |
| Immigrants | Uganda | 31.3 /100 | #192 | Fair 16.8% |
| Aleuts | 28.7 /100 | #193 | Fair 16.9% |
| Spanish | 28.6 /100 | #194 | Fair 16.9% |
| Immigrants | Costa Rica | 25.6 /100 | #195 | Fair 17.0% |
| Celtics | 25.2 /100 | #196 | Fair 17.0% |
| Spaniards | 24.9 /100 | #197 | Fair 17.0% |
| Immigrants | Lebanon | 22.6 /100 | #198 | Fair 17.1% |
| Immigrants | Afghanistan | 22.4 /100 | #199 | Fair 17.1% |
| Immigrants | Uzbekistan | 21.5 /100 | #200 | Fair 17.1% |
| Immigrants | Kenya | 17.8 /100 | #201 | Poor 17.2% |
| Immigrants | Sierra Leone | 17.6 /100 | #202 | Poor 17.2% |
| Ugandans | 17.5 /100 | #203 | Poor 17.2% |