Tsimshian vs Immigrants from St. Vincent and the Grenadines Child Poverty Among Girls Under 16
COMPARE
Tsimshian
Immigrants from St. Vincent and the Grenadines
Child Poverty Among Girls Under 16
Child Poverty Among Girls Under 16 Comparison
Tsimshian
Immigrants from St. Vincent and the Grenadines
11.5%
CHILD POVERTY AMONG GIRLS UNDER 16
100.0/ 100
METRIC RATING
4th/ 347
METRIC RANK
20.1%
CHILD POVERTY AMONG GIRLS UNDER 16
0.0/ 100
METRIC RATING
274th/ 347
METRIC RANK
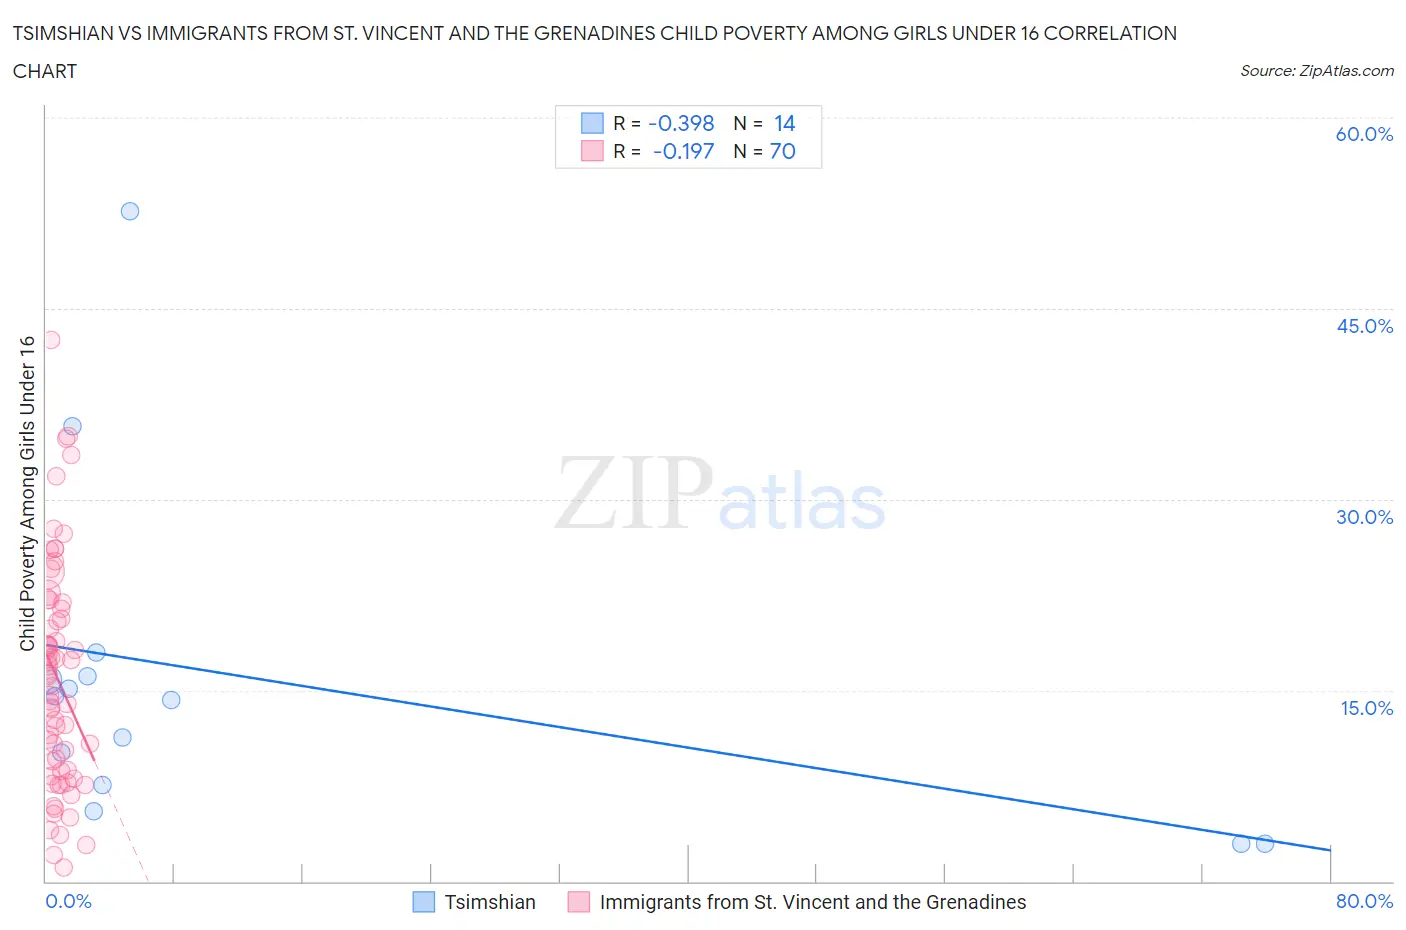
Tsimshian vs Immigrants from St. Vincent and the Grenadines Child Poverty Among Girls Under 16 Correlation Chart
The statistical analysis conducted on geographies consisting of 15,575,613 people shows a mild negative correlation between the proportion of Tsimshian and poverty level among girls under the age of 16 in the United States with a correlation coefficient (R) of -0.398 and weighted average of 11.5%. Similarly, the statistical analysis conducted on geographies consisting of 56,098,700 people shows a poor negative correlation between the proportion of Immigrants from St. Vincent and the Grenadines and poverty level among girls under the age of 16 in the United States with a correlation coefficient (R) of -0.197 and weighted average of 20.1%, a difference of 75.0%.
Child Poverty Among Girls Under 16 Correlation Summary
| Measurement | Tsimshian | Immigrants from St. Vincent and the Grenadines |
| Minimum | 2.9% | 1.1% |
| Maximum | 52.6% | 42.5% |
| Range | 49.7% | 41.4% |
| Mean | 15.9% | 15.9% |
| Median | 14.4% | 15.7% |
| Interquartile 25% (IQ1) | 7.5% | 8.6% |
| Interquartile 75% (IQ3) | 16.1% | 21.4% |
| Interquartile Range (IQR) | 8.5% | 12.7% |
| Standard Deviation (Sample) | 13.4% | 8.8% |
| Standard Deviation (Population) | 12.9% | 8.7% |
Similar Demographics by Child Poverty Among Girls Under 16
Demographics Similar to Tsimshian by Child Poverty Among Girls Under 16
In terms of child poverty among girls under 16, the demographic groups most similar to Tsimshian are Filipino (11.4%, a difference of 0.52%), Immigrants from Taiwan (11.3%, a difference of 1.4%), Thai (11.8%, a difference of 3.0%), Immigrants from India (11.0%, a difference of 4.1%), and Immigrants from Hong Kong (12.3%, a difference of 7.4%).
| Demographics | Rating | Rank | Child Poverty Among Girls Under 16 |
| Immigrants | India | 100.0 /100 | #1 | Exceptional 11.0% |
| Immigrants | Taiwan | 100.0 /100 | #2 | Exceptional 11.3% |
| Filipinos | 100.0 /100 | #3 | Exceptional 11.4% |
| Tsimshian | 100.0 /100 | #4 | Exceptional 11.5% |
| Thais | 100.0 /100 | #5 | Exceptional 11.8% |
| Immigrants | Hong Kong | 100.0 /100 | #6 | Exceptional 12.3% |
| Chinese | 100.0 /100 | #7 | Exceptional 12.3% |
| Iranians | 100.0 /100 | #8 | Exceptional 12.4% |
| Immigrants | Singapore | 100.0 /100 | #9 | Exceptional 12.5% |
| Immigrants | Iran | 100.0 /100 | #10 | Exceptional 12.6% |
| Immigrants | South Central Asia | 100.0 /100 | #11 | Exceptional 12.7% |
| Bhutanese | 100.0 /100 | #12 | Exceptional 12.7% |
| Immigrants | Ireland | 99.9 /100 | #13 | Exceptional 12.9% |
| Burmese | 99.9 /100 | #14 | Exceptional 13.0% |
| Okinawans | 99.9 /100 | #15 | Exceptional 13.0% |
Demographics Similar to Immigrants from St. Vincent and the Grenadines by Child Poverty Among Girls Under 16
In terms of child poverty among girls under 16, the demographic groups most similar to Immigrants from St. Vincent and the Grenadines are Subsaharan African (20.1%, a difference of 0.14%), Bangladeshi (20.0%, a difference of 0.42%), Comanche (20.2%, a difference of 0.46%), Belizean (20.2%, a difference of 0.57%), and Barbadian (20.2%, a difference of 0.60%).
| Demographics | Rating | Rank | Child Poverty Among Girls Under 16 |
| Immigrants | Bangladesh | 0.1 /100 | #267 | Tragic 19.9% |
| Spanish American Indians | 0.1 /100 | #268 | Tragic 19.9% |
| Liberians | 0.1 /100 | #269 | Tragic 19.9% |
| Cherokee | 0.1 /100 | #270 | Tragic 19.9% |
| Immigrants | Barbados | 0.1 /100 | #271 | Tragic 19.9% |
| Immigrants | El Salvador | 0.1 /100 | #272 | Tragic 20.0% |
| Bangladeshis | 0.1 /100 | #273 | Tragic 20.0% |
| Immigrants | St. Vincent and the Grenadines | 0.0 /100 | #274 | Tragic 20.1% |
| Sub-Saharan Africans | 0.0 /100 | #275 | Tragic 20.1% |
| Comanche | 0.0 /100 | #276 | Tragic 20.2% |
| Belizeans | 0.0 /100 | #277 | Tragic 20.2% |
| Barbadians | 0.0 /100 | #278 | Tragic 20.2% |
| Immigrants | Zaire | 0.0 /100 | #279 | Tragic 20.2% |
| Immigrants | Liberia | 0.0 /100 | #280 | Tragic 20.2% |
| Central Americans | 0.0 /100 | #281 | Tragic 20.2% |