Tsimshian vs Immigrants from Egypt Single Father Poverty
COMPARE
Tsimshian
Immigrants from Egypt
Single Father Poverty
Single Father Poverty Comparison
Tsimshian
Immigrants from Egypt
12.7%
SINGLE FATHER POVERTY
100.0/ 100
METRIC RATING
3rd/ 347
METRIC RANK
14.4%
SINGLE FATHER POVERTY
100.0/ 100
METRIC RATING
23rd/ 347
METRIC RANK
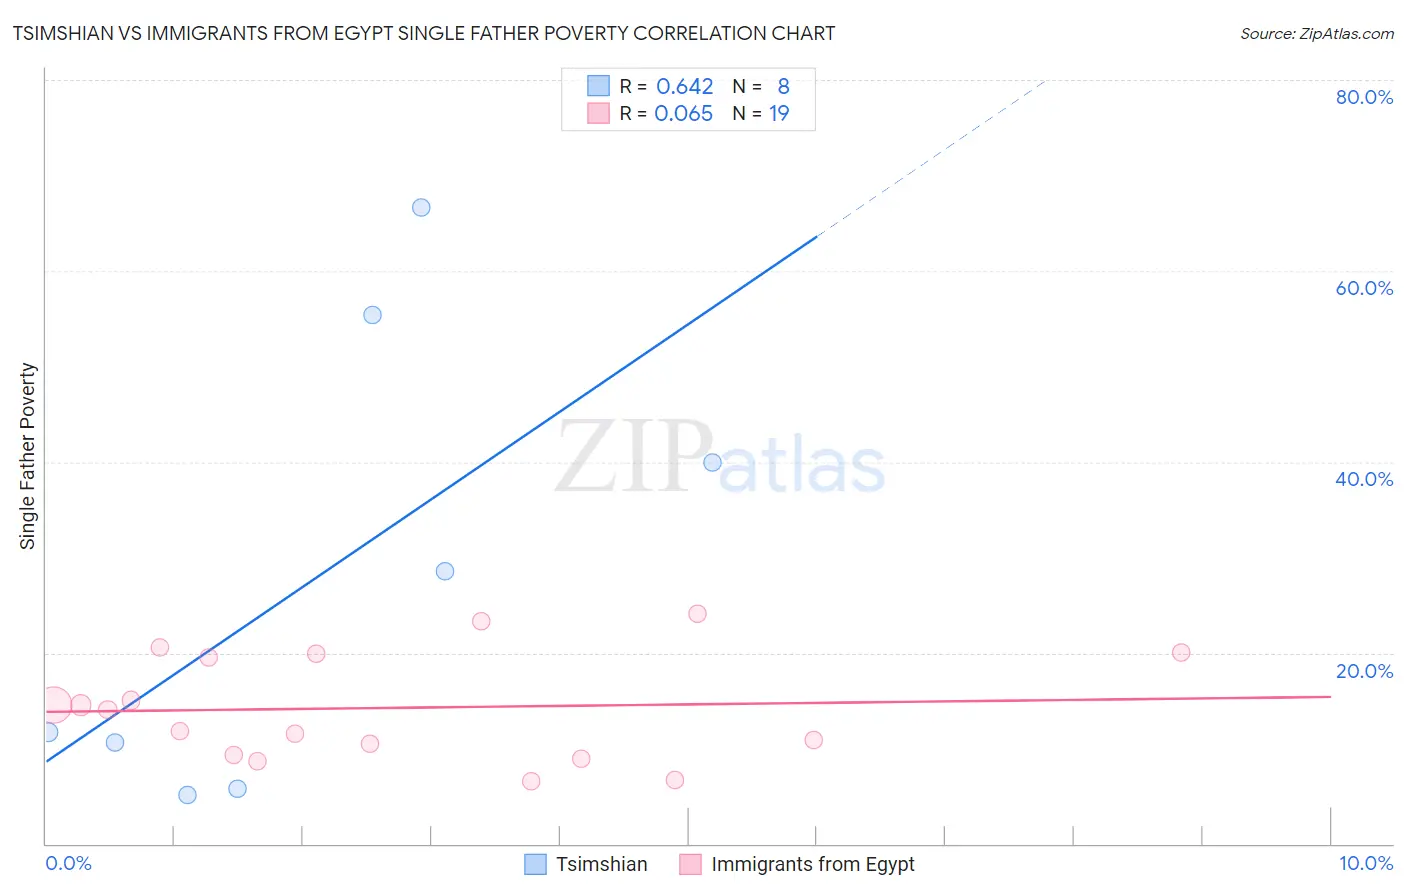
Tsimshian vs Immigrants from Egypt Single Father Poverty Correlation Chart
The statistical analysis conducted on geographies consisting of 14,553,815 people shows a significant positive correlation between the proportion of Tsimshian and poverty level among single fathers in the United States with a correlation coefficient (R) of 0.642 and weighted average of 12.7%. Similarly, the statistical analysis conducted on geographies consisting of 202,331,150 people shows a slight positive correlation between the proportion of Immigrants from Egypt and poverty level among single fathers in the United States with a correlation coefficient (R) of 0.065 and weighted average of 14.4%, a difference of 13.1%.
Single Father Poverty Correlation Summary
| Measurement | Tsimshian | Immigrants from Egypt |
| Minimum | 5.1% | 6.6% |
| Maximum | 66.7% | 24.1% |
| Range | 61.5% | 17.6% |
| Mean | 28.0% | 14.2% |
| Median | 20.1% | 14.0% |
| Interquartile 25% (IQ1) | 8.1% | 9.3% |
| Interquartile 75% (IQ3) | 47.7% | 19.9% |
| Interquartile Range (IQR) | 39.6% | 10.6% |
| Standard Deviation (Sample) | 23.9% | 5.5% |
| Standard Deviation (Population) | 22.3% | 5.4% |
Demographics Similar to Tsimshian and Immigrants from Egypt by Single Father Poverty
In terms of single father poverty, the demographic groups most similar to Tsimshian are Immigrants from Fiji (13.2%, a difference of 4.2%), Immigrants from Ethiopia (13.4%, a difference of 5.9%), Ethiopian (13.5%, a difference of 6.7%), Immigrants from Taiwan (13.7%, a difference of 7.8%), and Samoan (13.8%, a difference of 8.7%). Similarly, the demographic groups most similar to Immigrants from Egypt are Taiwanese (14.3%, a difference of 0.21%), Immigrants from Afghanistan (14.3%, a difference of 0.54%), Immigrants from Singapore (14.3%, a difference of 0.63%), Immigrants from Iraq (14.3%, a difference of 0.68%), and Soviet Union (14.3%, a difference of 0.72%).
| Demographics | Rating | Rank | Single Father Poverty |
| Tsimshian | 100.0 /100 | #3 | Exceptional 12.7% |
| Immigrants | Fiji | 100.0 /100 | #4 | Exceptional 13.2% |
| Immigrants | Ethiopia | 100.0 /100 | #5 | Exceptional 13.4% |
| Ethiopians | 100.0 /100 | #6 | Exceptional 13.5% |
| Immigrants | Taiwan | 100.0 /100 | #7 | Exceptional 13.7% |
| Samoans | 100.0 /100 | #8 | Exceptional 13.8% |
| Afghans | 100.0 /100 | #9 | Exceptional 14.0% |
| Koreans | 100.0 /100 | #10 | Exceptional 14.0% |
| Filipinos | 100.0 /100 | #11 | Exceptional 14.0% |
| Immigrants | India | 100.0 /100 | #12 | Exceptional 14.0% |
| Immigrants | Philippines | 100.0 /100 | #13 | Exceptional 14.0% |
| Immigrants | Vietnam | 100.0 /100 | #14 | Exceptional 14.1% |
| Sri Lankans | 100.0 /100 | #15 | Exceptional 14.2% |
| Immigrants | Iran | 100.0 /100 | #16 | Exceptional 14.2% |
| Immigrants | Hong Kong | 100.0 /100 | #17 | Exceptional 14.2% |
| Soviet Union | 100.0 /100 | #18 | Exceptional 14.3% |
| Immigrants | Iraq | 100.0 /100 | #19 | Exceptional 14.3% |
| Immigrants | Singapore | 100.0 /100 | #20 | Exceptional 14.3% |
| Immigrants | Afghanistan | 100.0 /100 | #21 | Exceptional 14.3% |
| Taiwanese | 100.0 /100 | #22 | Exceptional 14.3% |
| Immigrants | Egypt | 100.0 /100 | #23 | Exceptional 14.4% |