Tsimshian vs Immigrants from Eastern Europe Poverty
COMPARE
Tsimshian
Immigrants from Eastern Europe
Poverty
Poverty Comparison
Tsimshian
Immigrants from Eastern Europe
13.0%
POVERTY
9.2/ 100
METRIC RATING
205th/ 347
METRIC RANK
11.3%
POVERTY
97.0/ 100
METRIC RATING
75th/ 347
METRIC RANK
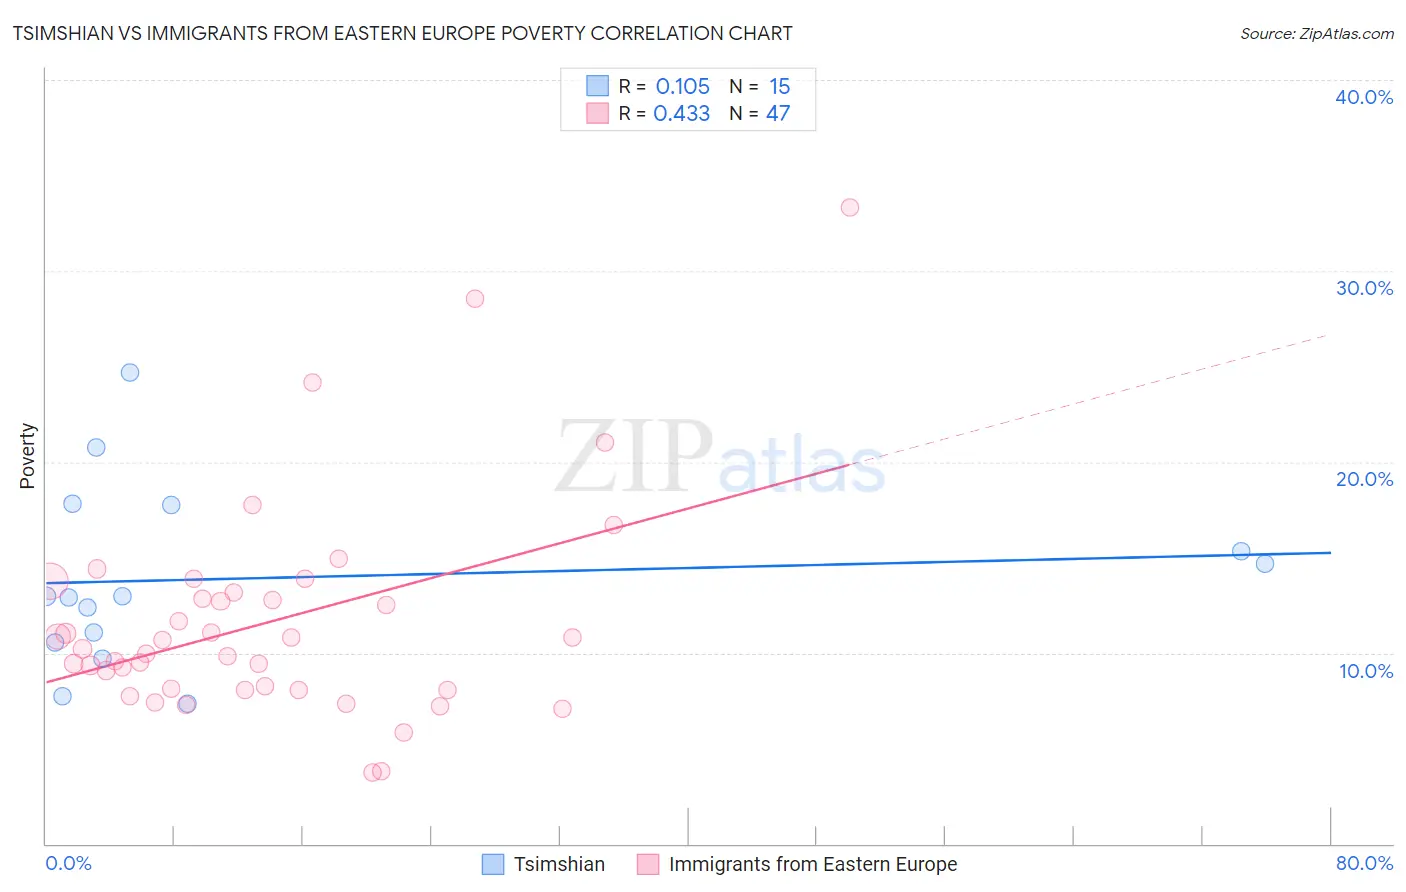
Tsimshian vs Immigrants from Eastern Europe Poverty Correlation Chart
The statistical analysis conducted on geographies consisting of 15,626,462 people shows a poor positive correlation between the proportion of Tsimshian and poverty level in the United States with a correlation coefficient (R) of 0.105 and weighted average of 13.0%. Similarly, the statistical analysis conducted on geographies consisting of 475,463,509 people shows a moderate positive correlation between the proportion of Immigrants from Eastern Europe and poverty level in the United States with a correlation coefficient (R) of 0.433 and weighted average of 11.3%, a difference of 15.2%.
Poverty Correlation Summary
| Measurement | Tsimshian | Immigrants from Eastern Europe |
| Minimum | 7.3% | 3.8% |
| Maximum | 24.7% | 33.3% |
| Range | 17.4% | 29.6% |
| Mean | 13.9% | 11.6% |
| Median | 12.9% | 10.2% |
| Interquartile 25% (IQ1) | 10.5% | 8.1% |
| Interquartile 75% (IQ3) | 17.7% | 13.2% |
| Interquartile Range (IQR) | 7.2% | 5.1% |
| Standard Deviation (Sample) | 4.8% | 5.7% |
| Standard Deviation (Population) | 4.6% | 5.6% |
Similar Demographics by Poverty
Demographics Similar to Tsimshian by Poverty
In terms of poverty, the demographic groups most similar to Tsimshian are Immigrants from Eastern Africa (13.1%, a difference of 0.70%), Panamanian (13.1%, a difference of 0.82%), Ugandan (13.1%, a difference of 0.98%), Malaysian (13.1%, a difference of 1.0%), and Immigrants from the Azores (13.1%, a difference of 1.0%).
| Demographics | Rating | Rank | Poverty |
| Spanish | 18.7 /100 | #198 | Poor 12.8% |
| Immigrants | Kenya | 17.5 /100 | #199 | Poor 12.8% |
| Spaniards | 16.5 /100 | #200 | Poor 12.8% |
| Immigrants | Uganda | 16.5 /100 | #201 | Poor 12.8% |
| Immigrants | Uruguay | 15.6 /100 | #202 | Poor 12.8% |
| Hmong | 15.0 /100 | #203 | Poor 12.8% |
| Immigrants | Western Asia | 14.1 /100 | #204 | Poor 12.9% |
| Tsimshian | 9.2 /100 | #205 | Tragic 13.0% |
| Immigrants | Eastern Africa | 7.0 /100 | #206 | Tragic 13.1% |
| Panamanians | 6.6 /100 | #207 | Tragic 13.1% |
| Ugandans | 6.2 /100 | #208 | Tragic 13.1% |
| Malaysians | 6.1 /100 | #209 | Tragic 13.1% |
| Immigrants | Azores | 6.1 /100 | #210 | Tragic 13.1% |
| Moroccans | 5.2 /100 | #211 | Tragic 13.2% |
| Immigrants | Immigrants | 4.3 /100 | #212 | Tragic 13.2% |
Demographics Similar to Immigrants from Eastern Europe by Poverty
In terms of poverty, the demographic groups most similar to Immigrants from Eastern Europe are Immigrants from North America (11.3%, a difference of 0.15%), Carpatho Rusyn (11.3%, a difference of 0.19%), Immigrants from Eastern Asia (11.3%, a difference of 0.22%), European (11.3%, a difference of 0.24%), and Immigrants from Belgium (11.3%, a difference of 0.24%).
| Demographics | Rating | Rank | Poverty |
| Slovaks | 97.4 /100 | #68 | Exceptional 11.2% |
| Serbians | 97.4 /100 | #69 | Exceptional 11.2% |
| Immigrants | Canada | 97.3 /100 | #70 | Exceptional 11.3% |
| Zimbabweans | 97.3 /100 | #71 | Exceptional 11.3% |
| Europeans | 97.2 /100 | #72 | Exceptional 11.3% |
| Immigrants | Belgium | 97.2 /100 | #73 | Exceptional 11.3% |
| Carpatho Rusyns | 97.2 /100 | #74 | Exceptional 11.3% |
| Immigrants | Eastern Europe | 97.0 /100 | #75 | Exceptional 11.3% |
| Immigrants | North America | 96.8 /100 | #76 | Exceptional 11.3% |
| Immigrants | Eastern Asia | 96.7 /100 | #77 | Exceptional 11.3% |
| Dutch | 96.7 /100 | #78 | Exceptional 11.3% |
| Cambodians | 96.7 /100 | #79 | Exceptional 11.3% |
| Indians (Asian) | 96.6 /100 | #80 | Exceptional 11.3% |
| Irish | 96.6 /100 | #81 | Exceptional 11.3% |
| Egyptians | 96.5 /100 | #82 | Exceptional 11.3% |