Trinidadian and Tobagonian vs Syrian Child Poverty Among Girls Under 16
COMPARE
Trinidadian and Tobagonian
Syrian
Child Poverty Among Girls Under 16
Child Poverty Among Girls Under 16 Comparison
Trinidadians and Tobagonians
Syrians
19.3%
CHILD POVERTY AMONG GIRLS UNDER 16
0.2/ 100
METRIC RATING
256th/ 347
METRIC RANK
15.9%
CHILD POVERTY AMONG GIRLS UNDER 16
76.7/ 100
METRIC RATING
155th/ 347
METRIC RANK
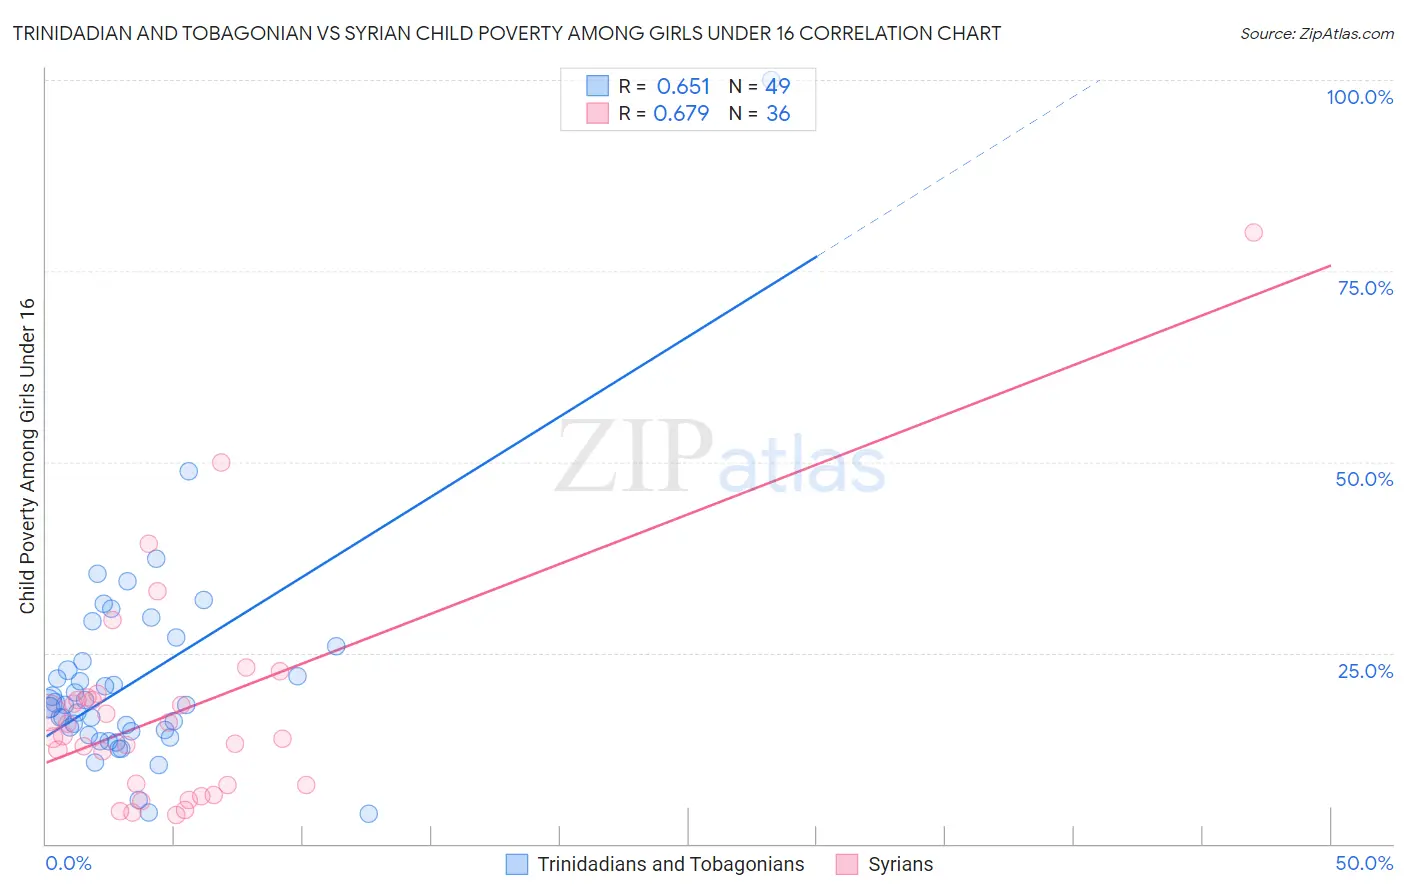
Trinidadian and Tobagonian vs Syrian Child Poverty Among Girls Under 16 Correlation Chart
The statistical analysis conducted on geographies consisting of 217,787,777 people shows a significant positive correlation between the proportion of Trinidadians and Tobagonians and poverty level among girls under the age of 16 in the United States with a correlation coefficient (R) of 0.651 and weighted average of 19.3%. Similarly, the statistical analysis conducted on geographies consisting of 262,279,372 people shows a significant positive correlation between the proportion of Syrians and poverty level among girls under the age of 16 in the United States with a correlation coefficient (R) of 0.679 and weighted average of 15.9%, a difference of 21.4%.
Child Poverty Among Girls Under 16 Correlation Summary
| Measurement | Trinidadian and Tobagonian | Syrian |
| Minimum | 3.9% | 3.7% |
| Maximum | 100.0% | 80.0% |
| Range | 96.1% | 76.2% |
| Mean | 21.4% | 17.4% |
| Median | 18.2% | 14.0% |
| Interquartile 25% (IQ1) | 14.4% | 7.7% |
| Interquartile 75% (IQ3) | 24.9% | 19.0% |
| Interquartile Range (IQR) | 10.4% | 11.4% |
| Standard Deviation (Sample) | 14.4% | 14.7% |
| Standard Deviation (Population) | 14.3% | 14.5% |
Similar Demographics by Child Poverty Among Girls Under 16
Demographics Similar to Trinidadians and Tobagonians by Child Poverty Among Girls Under 16
In terms of child poverty among girls under 16, the demographic groups most similar to Trinidadians and Tobagonians are Immigrants from Ecuador (19.3%, a difference of 0.060%), Immigrants from Western Africa (19.3%, a difference of 0.080%), Immigrants from Guyana (19.3%, a difference of 0.15%), Guyanese (19.4%, a difference of 0.25%), and Immigrants from Middle Africa (19.2%, a difference of 0.34%).
| Demographics | Rating | Rank | Child Poverty Among Girls Under 16 |
| Potawatomi | 0.3 /100 | #249 | Tragic 19.2% |
| Cape Verdeans | 0.3 /100 | #250 | Tragic 19.2% |
| Immigrants | Trinidad and Tobago | 0.3 /100 | #251 | Tragic 19.2% |
| Immigrants | Middle Africa | 0.3 /100 | #252 | Tragic 19.2% |
| Immigrants | Guyana | 0.3 /100 | #253 | Tragic 19.3% |
| Immigrants | Western Africa | 0.3 /100 | #254 | Tragic 19.3% |
| Immigrants | Ecuador | 0.3 /100 | #255 | Tragic 19.3% |
| Trinidadians and Tobagonians | 0.2 /100 | #256 | Tragic 19.3% |
| Guyanese | 0.2 /100 | #257 | Tragic 19.4% |
| Salvadorans | 0.2 /100 | #258 | Tragic 19.4% |
| Ottawa | 0.2 /100 | #259 | Tragic 19.4% |
| Mexican American Indians | 0.2 /100 | #260 | Tragic 19.5% |
| Vietnamese | 0.2 /100 | #261 | Tragic 19.5% |
| Chickasaw | 0.1 /100 | #262 | Tragic 19.6% |
| Immigrants | Burma/Myanmar | 0.1 /100 | #263 | Tragic 19.7% |
Demographics Similar to Syrians by Child Poverty Among Girls Under 16
In terms of child poverty among girls under 16, the demographic groups most similar to Syrians are Immigrants from Chile (15.9%, a difference of 0.010%), Immigrants from Fiji (15.9%, a difference of 0.10%), Colombian (15.9%, a difference of 0.10%), Guamanian/Chamorro (15.9%, a difference of 0.22%), and Slovak (15.9%, a difference of 0.23%).
| Demographics | Rating | Rank | Child Poverty Among Girls Under 16 |
| Icelanders | 82.4 /100 | #148 | Excellent 15.7% |
| Immigrants | Hungary | 80.9 /100 | #149 | Excellent 15.8% |
| Immigrants | Albania | 80.7 /100 | #150 | Excellent 15.8% |
| Venezuelans | 80.1 /100 | #151 | Excellent 15.8% |
| Immigrants | Kuwait | 79.4 /100 | #152 | Good 15.8% |
| Immigrants | Nepal | 78.5 /100 | #153 | Good 15.9% |
| Immigrants | Chile | 76.7 /100 | #154 | Good 15.9% |
| Syrians | 76.7 /100 | #155 | Good 15.9% |
| Immigrants | Fiji | 76.1 /100 | #156 | Good 15.9% |
| Colombians | 76.1 /100 | #157 | Good 15.9% |
| Guamanians/Chamorros | 75.3 /100 | #158 | Good 15.9% |
| Slovaks | 75.2 /100 | #159 | Good 15.9% |
| French | 72.8 /100 | #160 | Good 16.0% |
| Immigrants | Northern Africa | 72.0 /100 | #161 | Good 16.0% |
| French Canadians | 68.7 /100 | #162 | Good 16.1% |