Tongan vs Slavic Seniors Poverty Over the Age of 65
COMPARE
Tongan
Slavic
Seniors Poverty Over the Age of 65
Seniors Poverty Over the Age of 65 Comparison
Tongans
Slavs
9.3%
SENIORS POVERTY OVER THE AGE OF 65
99.9/ 100
METRIC RATING
28th/ 347
METRIC RANK
9.8%
SENIORS POVERTY OVER THE AGE OF 65
99.2/ 100
METRIC RATING
53rd/ 347
METRIC RANK
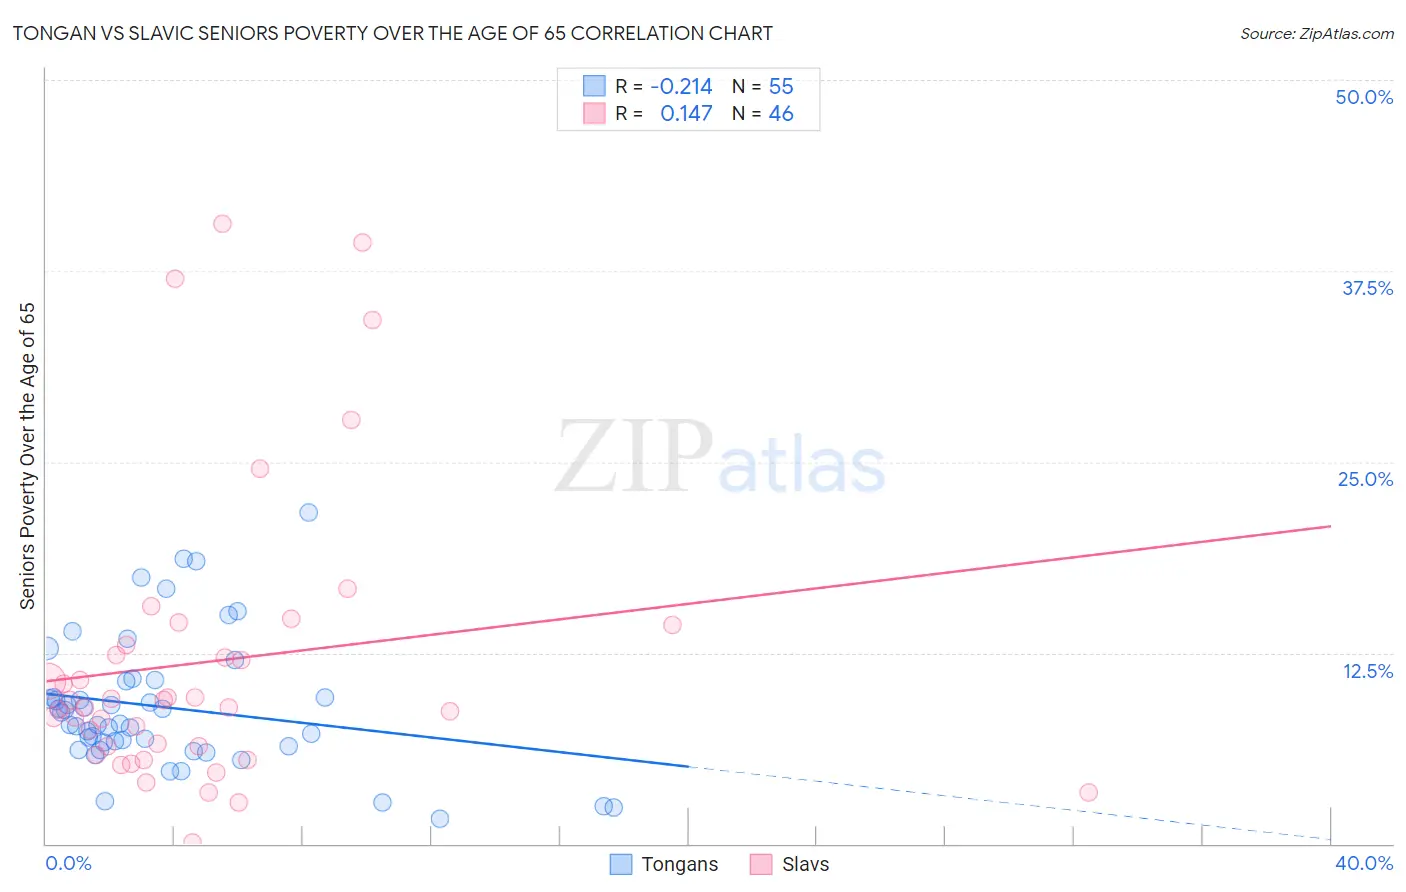
Tongan vs Slavic Seniors Poverty Over the Age of 65 Correlation Chart
The statistical analysis conducted on geographies consisting of 102,677,061 people shows a weak negative correlation between the proportion of Tongans and poverty level among seniors over the age of 65 in the United States with a correlation coefficient (R) of -0.214 and weighted average of 9.3%. Similarly, the statistical analysis conducted on geographies consisting of 270,346,307 people shows a poor positive correlation between the proportion of Slavs and poverty level among seniors over the age of 65 in the United States with a correlation coefficient (R) of 0.147 and weighted average of 9.8%, a difference of 4.8%.
Seniors Poverty Over the Age of 65 Correlation Summary
| Measurement | Tongan | Slavic |
| Minimum | 1.6% | 0.12% |
| Maximum | 21.7% | 40.6% |
| Range | 20.1% | 40.4% |
| Mean | 8.9% | 11.9% |
| Median | 7.9% | 9.2% |
| Interquartile 25% (IQ1) | 6.4% | 6.4% |
| Interquartile 75% (IQ3) | 10.6% | 13.0% |
| Interquartile Range (IQR) | 4.3% | 6.6% |
| Standard Deviation (Sample) | 4.3% | 9.6% |
| Standard Deviation (Population) | 4.2% | 9.5% |
Similar Demographics by Seniors Poverty Over the Age of 65
Demographics Similar to Tongans by Seniors Poverty Over the Age of 65
In terms of seniors poverty over the age of 65, the demographic groups most similar to Tongans are Italian (9.3%, a difference of 0.20%), Immigrants from Scotland (9.3%, a difference of 0.27%), Irish (9.3%, a difference of 0.30%), Bhutanese (9.3%, a difference of 0.32%), and Menominee (9.4%, a difference of 0.48%).
| Demographics | Rating | Rank | Seniors Poverty Over the Age of 65 |
| Luxembourgers | 99.9 /100 | #21 | Exceptional 9.2% |
| Slovenes | 99.9 /100 | #22 | Exceptional 9.3% |
| Welsh | 99.9 /100 | #23 | Exceptional 9.3% |
| Bulgarians | 99.9 /100 | #24 | Exceptional 9.3% |
| Irish | 99.9 /100 | #25 | Exceptional 9.3% |
| Immigrants | Scotland | 99.9 /100 | #26 | Exceptional 9.3% |
| Italians | 99.9 /100 | #27 | Exceptional 9.3% |
| Tongans | 99.9 /100 | #28 | Exceptional 9.3% |
| Bhutanese | 99.9 /100 | #29 | Exceptional 9.3% |
| Menominee | 99.8 /100 | #30 | Exceptional 9.4% |
| Finns | 99.8 /100 | #31 | Exceptional 9.4% |
| Northern Europeans | 99.8 /100 | #32 | Exceptional 9.4% |
| Native Hawaiians | 99.8 /100 | #33 | Exceptional 9.4% |
| British | 99.8 /100 | #34 | Exceptional 9.4% |
| Latvians | 99.8 /100 | #35 | Exceptional 9.5% |
Demographics Similar to Slavs by Seniors Poverty Over the Age of 65
In terms of seniors poverty over the age of 65, the demographic groups most similar to Slavs are Immigrants from Northern Europe (9.8%, a difference of 0.060%), Filipino (9.7%, a difference of 0.11%), Carpatho Rusyn (9.7%, a difference of 0.13%), Afghan (9.8%, a difference of 0.19%), and Immigrants from England (9.8%, a difference of 0.31%).
| Demographics | Rating | Rank | Seniors Poverty Over the Age of 65 |
| Immigrants | Taiwan | 99.5 /100 | #46 | Exceptional 9.7% |
| Immigrants | South Central Asia | 99.5 /100 | #47 | Exceptional 9.7% |
| French | 99.5 /100 | #48 | Exceptional 9.7% |
| Immigrants | Lithuania | 99.4 /100 | #49 | Exceptional 9.7% |
| Hungarians | 99.4 /100 | #50 | Exceptional 9.7% |
| Carpatho Rusyns | 99.3 /100 | #51 | Exceptional 9.7% |
| Filipinos | 99.3 /100 | #52 | Exceptional 9.7% |
| Slavs | 99.2 /100 | #53 | Exceptional 9.8% |
| Immigrants | Northern Europe | 99.2 /100 | #54 | Exceptional 9.8% |
| Afghans | 99.2 /100 | #55 | Exceptional 9.8% |
| Immigrants | England | 99.1 /100 | #56 | Exceptional 9.8% |
| Bolivians | 99.1 /100 | #57 | Exceptional 9.8% |
| Serbians | 99.1 /100 | #58 | Exceptional 9.8% |
| Immigrants | Canada | 99.0 /100 | #59 | Exceptional 9.8% |
| Celtics | 99.0 /100 | #60 | Exceptional 9.8% |