Tlingit-Haida vs Israeli Seniors Poverty Over the Age of 75
COMPARE
Tlingit-Haida
Israeli
Seniors Poverty Over the Age of 75
Seniors Poverty Over the Age of 75 Comparison
Tlingit-Haida
Israelis
9.7%
SENIORS POVERTY OVER THE AGE OF 75
100.0/ 100
METRIC RATING
2nd/ 347
METRIC RANK
13.2%
SENIORS POVERTY OVER THE AGE OF 75
2.0/ 100
METRIC RATING
228th/ 347
METRIC RANK
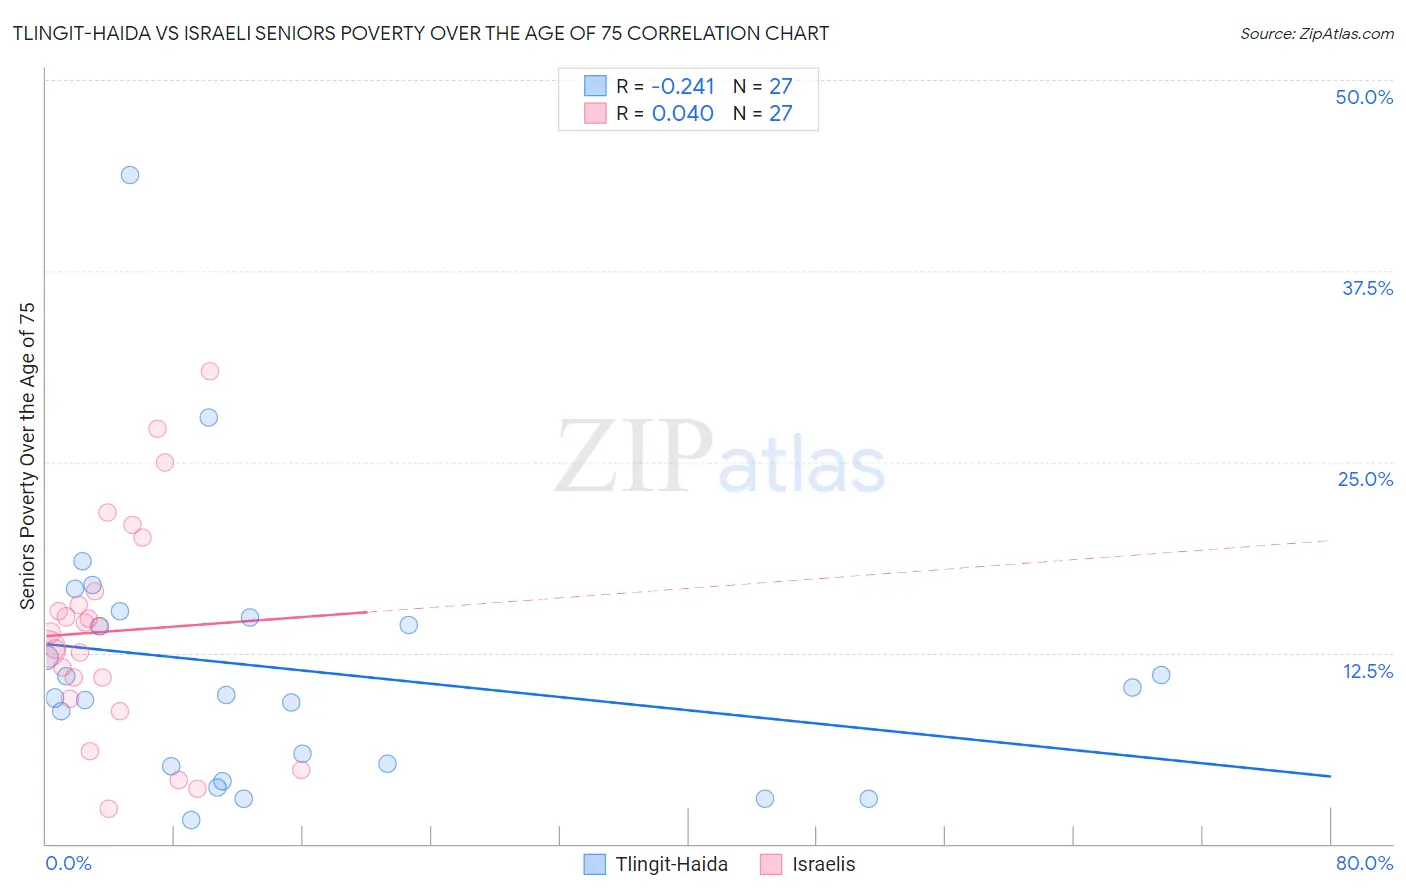
Tlingit-Haida vs Israeli Seniors Poverty Over the Age of 75 Correlation Chart
The statistical analysis conducted on geographies consisting of 60,526,405 people shows a weak negative correlation between the proportion of Tlingit-Haida and poverty level among seniors over the age of 75 in the United States with a correlation coefficient (R) of -0.241 and weighted average of 9.7%. Similarly, the statistical analysis conducted on geographies consisting of 209,472,862 people shows no correlation between the proportion of Israelis and poverty level among seniors over the age of 75 in the United States with a correlation coefficient (R) of 0.040 and weighted average of 13.2%, a difference of 35.6%.
Seniors Poverty Over the Age of 75 Correlation Summary
| Measurement | Tlingit-Haida | Israeli |
| Minimum | 1.5% | 2.3% |
| Maximum | 43.8% | 30.9% |
| Range | 42.2% | 28.6% |
| Mean | 11.4% | 13.9% |
| Median | 9.7% | 13.8% |
| Interquartile 25% (IQ1) | 5.0% | 9.5% |
| Interquartile 75% (IQ3) | 14.8% | 16.5% |
| Interquartile Range (IQR) | 9.8% | 7.0% |
| Standard Deviation (Sample) | 8.8% | 7.1% |
| Standard Deviation (Population) | 8.7% | 6.9% |
Similar Demographics by Seniors Poverty Over the Age of 75
Demographics Similar to Tlingit-Haida by Seniors Poverty Over the Age of 75
In terms of seniors poverty over the age of 75, the demographic groups most similar to Tlingit-Haida are Native Hawaiian (10.1%, a difference of 3.8%), Swedish (10.2%, a difference of 4.7%), Norwegian (10.2%, a difference of 5.1%), Danish (10.2%, a difference of 5.4%), and Maltese (10.3%, a difference of 6.1%).
| Demographics | Rating | Rank | Seniors Poverty Over the Age of 75 |
| Chinese | 100.0 /100 | #1 | Exceptional 9.1% |
| Tlingit-Haida | 100.0 /100 | #2 | Exceptional 9.7% |
| Native Hawaiians | 100.0 /100 | #3 | Exceptional 10.1% |
| Swedes | 100.0 /100 | #4 | Exceptional 10.2% |
| Norwegians | 100.0 /100 | #5 | Exceptional 10.2% |
| Danes | 100.0 /100 | #6 | Exceptional 10.2% |
| Maltese | 100.0 /100 | #7 | Exceptional 10.3% |
| Germans | 99.9 /100 | #8 | Exceptional 10.4% |
| English | 99.9 /100 | #9 | Exceptional 10.4% |
| Scandinavians | 99.9 /100 | #10 | Exceptional 10.4% |
| Immigrants | India | 99.9 /100 | #11 | Exceptional 10.4% |
| Tongans | 99.9 /100 | #12 | Exceptional 10.5% |
| Croatians | 99.9 /100 | #13 | Exceptional 10.5% |
| Scottish | 99.9 /100 | #14 | Exceptional 10.5% |
| Europeans | 99.9 /100 | #15 | Exceptional 10.5% |
Demographics Similar to Israelis by Seniors Poverty Over the Age of 75
In terms of seniors poverty over the age of 75, the demographic groups most similar to Israelis are Cree (13.1%, a difference of 0.28%), Somali (13.2%, a difference of 0.44%), Immigrants from China (13.2%, a difference of 0.52%), Subsaharan African (13.2%, a difference of 0.53%), and Shoshone (13.1%, a difference of 0.55%).
| Demographics | Rating | Rank | Seniors Poverty Over the Age of 75 |
| Immigrants | Kazakhstan | 4.3 /100 | #221 | Tragic 13.0% |
| Nigerians | 3.4 /100 | #222 | Tragic 13.0% |
| Immigrants | Nigeria | 3.3 /100 | #223 | Tragic 13.0% |
| Chippewa | 2.9 /100 | #224 | Tragic 13.1% |
| Immigrants | Morocco | 2.8 /100 | #225 | Tragic 13.1% |
| Shoshone | 2.6 /100 | #226 | Tragic 13.1% |
| Cree | 2.3 /100 | #227 | Tragic 13.1% |
| Israelis | 2.0 /100 | #228 | Tragic 13.2% |
| Somalis | 1.6 /100 | #229 | Tragic 13.2% |
| Immigrants | China | 1.5 /100 | #230 | Tragic 13.2% |
| Sub-Saharan Africans | 1.5 /100 | #231 | Tragic 13.2% |
| Immigrants | Chile | 1.3 /100 | #232 | Tragic 13.3% |
| Immigrants | Costa Rica | 1.3 /100 | #233 | Tragic 13.3% |
| Immigrants | Israel | 1.1 /100 | #234 | Tragic 13.3% |
| Japanese | 0.9 /100 | #235 | Tragic 13.3% |