Tlingit-Haida vs Immigrants from Germany Female Poverty Among 18-24 Year Olds
COMPARE
Tlingit-Haida
Immigrants from Germany
Female Poverty Among 18-24 Year Olds
Female Poverty Among 18-24 Year Olds Comparison
Tlingit-Haida
Immigrants from Germany
22.0%
FEMALE POVERTY AMONG 18-24 YEAR OLDS
0.0/ 100
METRIC RATING
284th/ 347
METRIC RANK
20.3%
FEMALE POVERTY AMONG 18-24 YEAR OLDS
34.0/ 100
METRIC RATING
189th/ 347
METRIC RANK
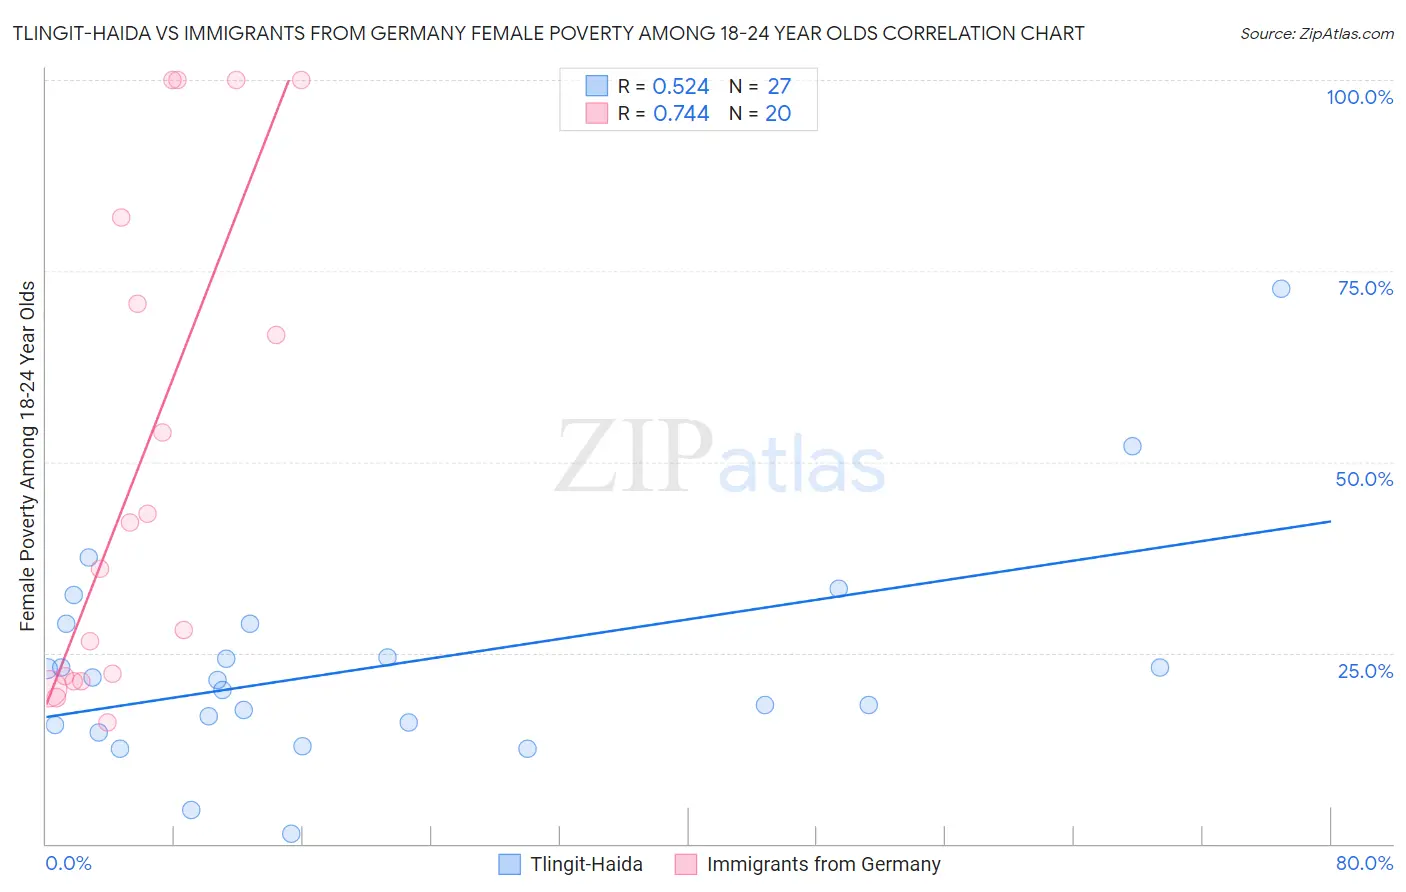
Tlingit-Haida vs Immigrants from Germany Female Poverty Among 18-24 Year Olds Correlation Chart
The statistical analysis conducted on geographies consisting of 60,396,606 people shows a substantial positive correlation between the proportion of Tlingit-Haida and poverty level among females between the ages 18 and 24 in the United States with a correlation coefficient (R) of 0.524 and weighted average of 22.0%. Similarly, the statistical analysis conducted on geographies consisting of 447,977,087 people shows a strong positive correlation between the proportion of Immigrants from Germany and poverty level among females between the ages 18 and 24 in the United States with a correlation coefficient (R) of 0.744 and weighted average of 20.3%, a difference of 8.6%.
Female Poverty Among 18-24 Year Olds Correlation Summary
| Measurement | Tlingit-Haida | Immigrants from Germany |
| Minimum | 1.3% | 15.9% |
| Maximum | 72.7% | 100.0% |
| Range | 71.4% | 84.1% |
| Mean | 23.2% | 49.5% |
| Median | 21.4% | 39.0% |
| Interquartile 25% (IQ1) | 15.6% | 21.6% |
| Interquartile 75% (IQ3) | 28.8% | 76.3% |
| Interquartile Range (IQR) | 13.2% | 54.7% |
| Standard Deviation (Sample) | 14.2% | 31.9% |
| Standard Deviation (Population) | 13.9% | 31.1% |
Similar Demographics by Female Poverty Among 18-24 Year Olds
Demographics Similar to Tlingit-Haida by Female Poverty Among 18-24 Year Olds
In terms of female poverty among 18-24 year olds, the demographic groups most similar to Tlingit-Haida are Subsaharan African (22.0%, a difference of 0.010%), Ottawa (22.0%, a difference of 0.12%), Bermudan (21.9%, a difference of 0.31%), Ugandan (22.1%, a difference of 0.31%), and Immigrants from Middle Africa (22.1%, a difference of 0.32%).
| Demographics | Rating | Rank | Female Poverty Among 18-24 Year Olds |
| Immigrants | Switzerland | 0.1 /100 | #277 | Tragic 21.8% |
| Yaqui | 0.1 /100 | #278 | Tragic 21.9% |
| Spanish Americans | 0.1 /100 | #279 | Tragic 21.9% |
| Immigrants | Dominica | 0.1 /100 | #280 | Tragic 21.9% |
| Immigrants | Dominican Republic | 0.1 /100 | #281 | Tragic 21.9% |
| Bermudans | 0.1 /100 | #282 | Tragic 21.9% |
| Sub-Saharan Africans | 0.0 /100 | #283 | Tragic 22.0% |
| Tlingit-Haida | 0.0 /100 | #284 | Tragic 22.0% |
| Ottawa | 0.0 /100 | #285 | Tragic 22.0% |
| Ugandans | 0.0 /100 | #286 | Tragic 22.1% |
| Immigrants | Middle Africa | 0.0 /100 | #287 | Tragic 22.1% |
| Dominicans | 0.0 /100 | #288 | Tragic 22.3% |
| French American Indians | 0.0 /100 | #289 | Tragic 22.3% |
| Immigrants | Senegal | 0.0 /100 | #290 | Tragic 22.4% |
| Bangladeshis | 0.0 /100 | #291 | Tragic 22.5% |
Demographics Similar to Immigrants from Germany by Female Poverty Among 18-24 Year Olds
In terms of female poverty among 18-24 year olds, the demographic groups most similar to Immigrants from Germany are Scandinavian (20.3%, a difference of 0.030%), Immigrants from Mexico (20.2%, a difference of 0.12%), Immigrants from Ethiopia (20.2%, a difference of 0.17%), Immigrants from Western Asia (20.3%, a difference of 0.27%), and Nepalese (20.2%, a difference of 0.30%).
| Demographics | Rating | Rank | Female Poverty Among 18-24 Year Olds |
| Immigrants | Barbados | 42.8 /100 | #182 | Average 20.2% |
| Lebanese | 40.6 /100 | #183 | Average 20.2% |
| Immigrants | Central America | 39.9 /100 | #184 | Fair 20.2% |
| Nepalese | 39.7 /100 | #185 | Fair 20.2% |
| Immigrants | Ethiopia | 37.3 /100 | #186 | Fair 20.2% |
| Immigrants | Mexico | 36.3 /100 | #187 | Fair 20.2% |
| Scandinavians | 34.6 /100 | #188 | Fair 20.3% |
| Immigrants | Germany | 34.0 /100 | #189 | Fair 20.3% |
| Immigrants | Western Asia | 29.3 /100 | #190 | Fair 20.3% |
| Moroccans | 25.8 /100 | #191 | Fair 20.4% |
| Immigrants | Israel | 24.4 /100 | #192 | Fair 20.4% |
| Nigerians | 23.4 /100 | #193 | Fair 20.4% |
| Mexican American Indians | 23.2 /100 | #194 | Fair 20.4% |
| Immigrants | Latvia | 23.0 /100 | #195 | Fair 20.4% |
| Czechs | 22.3 /100 | #196 | Fair 20.4% |