Tlingit-Haida vs Finnish Male Poverty
COMPARE
Tlingit-Haida
Finnish
Male Poverty
Male Poverty Comparison
Tlingit-Haida
Finns
10.9%
MALE POVERTY
76.1/ 100
METRIC RATING
140th/ 347
METRIC RANK
10.5%
MALE POVERTY
93.4/ 100
METRIC RATING
98th/ 347
METRIC RANK
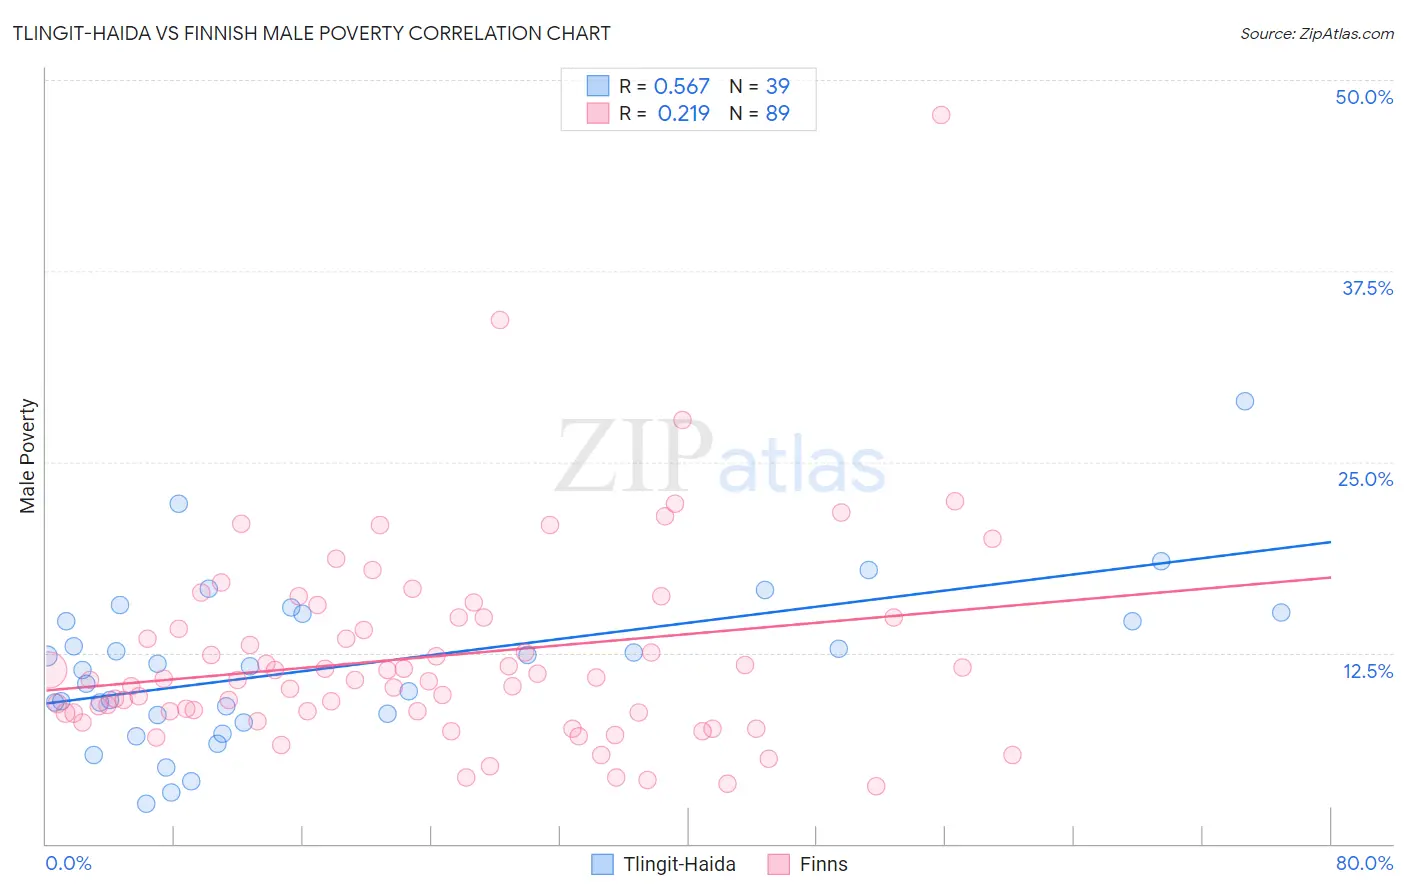
Tlingit-Haida vs Finnish Male Poverty Correlation Chart
The statistical analysis conducted on geographies consisting of 60,854,564 people shows a substantial positive correlation between the proportion of Tlingit-Haida and poverty level among males in the United States with a correlation coefficient (R) of 0.567 and weighted average of 10.9%. Similarly, the statistical analysis conducted on geographies consisting of 404,315,970 people shows a weak positive correlation between the proportion of Finns and poverty level among males in the United States with a correlation coefficient (R) of 0.219 and weighted average of 10.5%, a difference of 3.9%.
Male Poverty Correlation Summary
| Measurement | Tlingit-Haida | Finnish |
| Minimum | 2.6% | 3.8% |
| Maximum | 28.9% | 47.7% |
| Range | 26.3% | 43.9% |
| Mean | 11.7% | 12.3% |
| Median | 11.6% | 10.8% |
| Interquartile 25% (IQ1) | 8.5% | 8.6% |
| Interquartile 75% (IQ3) | 15.1% | 14.8% |
| Interquartile Range (IQR) | 6.6% | 6.3% |
| Standard Deviation (Sample) | 5.2% | 6.6% |
| Standard Deviation (Population) | 5.2% | 6.6% |
Similar Demographics by Male Poverty
Demographics Similar to Tlingit-Haida by Male Poverty
In terms of male poverty, the demographic groups most similar to Tlingit-Haida are Immigrants from France (10.9%, a difference of 0.030%), Immigrants from Jordan (10.8%, a difference of 0.19%), Basque (10.9%, a difference of 0.20%), Yugoslavian (10.8%, a difference of 0.31%), and Immigrants from Switzerland (10.8%, a difference of 0.46%).
| Demographics | Rating | Rank | Male Poverty |
| Pakistanis | 83.0 /100 | #133 | Excellent 10.8% |
| New Zealanders | 82.9 /100 | #134 | Excellent 10.8% |
| Brazilians | 82.7 /100 | #135 | Excellent 10.8% |
| Immigrants | Israel | 80.9 /100 | #136 | Excellent 10.8% |
| Immigrants | Switzerland | 79.2 /100 | #137 | Good 10.8% |
| Yugoslavians | 78.2 /100 | #138 | Good 10.8% |
| Immigrants | Jordan | 77.5 /100 | #139 | Good 10.8% |
| Tlingit-Haida | 76.1 /100 | #140 | Good 10.9% |
| Immigrants | France | 75.8 /100 | #141 | Good 10.9% |
| Basques | 74.6 /100 | #142 | Good 10.9% |
| Afghans | 71.9 /100 | #143 | Good 10.9% |
| Samoans | 71.8 /100 | #144 | Good 10.9% |
| Immigrants | Germany | 71.6 /100 | #145 | Good 10.9% |
| Syrians | 71.4 /100 | #146 | Good 10.9% |
| Icelanders | 68.5 /100 | #147 | Good 11.0% |
Demographics Similar to Finns by Male Poverty
In terms of male poverty, the demographic groups most similar to Finns are Romanian (10.5%, a difference of 0.060%), Immigrants from Indonesia (10.5%, a difference of 0.060%), Immigrants from Egypt (10.4%, a difference of 0.11%), Scottish (10.4%, a difference of 0.24%), and Immigrants from South Africa (10.4%, a difference of 0.28%).
| Demographics | Rating | Rank | Male Poverty |
| British | 94.8 /100 | #91 | Exceptional 10.4% |
| Jordanians | 94.4 /100 | #92 | Exceptional 10.4% |
| Australians | 94.4 /100 | #93 | Exceptional 10.4% |
| Immigrants | South Africa | 94.1 /100 | #94 | Exceptional 10.4% |
| Scottish | 94.0 /100 | #95 | Exceptional 10.4% |
| Immigrants | Egypt | 93.7 /100 | #96 | Exceptional 10.4% |
| Romanians | 93.6 /100 | #97 | Exceptional 10.5% |
| Finns | 93.4 /100 | #98 | Exceptional 10.5% |
| Immigrants | Indonesia | 93.3 /100 | #99 | Exceptional 10.5% |
| Immigrants | Latvia | 92.8 /100 | #100 | Exceptional 10.5% |
| Immigrants | Zimbabwe | 92.0 /100 | #101 | Exceptional 10.5% |
| French Canadians | 91.9 /100 | #102 | Exceptional 10.5% |
| Slavs | 91.7 /100 | #103 | Exceptional 10.5% |
| Welsh | 91.6 /100 | #104 | Exceptional 10.5% |
| Canadians | 91.6 /100 | #105 | Exceptional 10.5% |