Thai vs Immigrants from Ethiopia Single Father Poverty
COMPARE
Thai
Immigrants from Ethiopia
Single Father Poverty
Single Father Poverty Comparison
Thais
Immigrants from Ethiopia
14.5%
SINGLE FATHER POVERTY
100.0/ 100
METRIC RATING
30th/ 347
METRIC RANK
13.4%
SINGLE FATHER POVERTY
100.0/ 100
METRIC RATING
5th/ 347
METRIC RANK
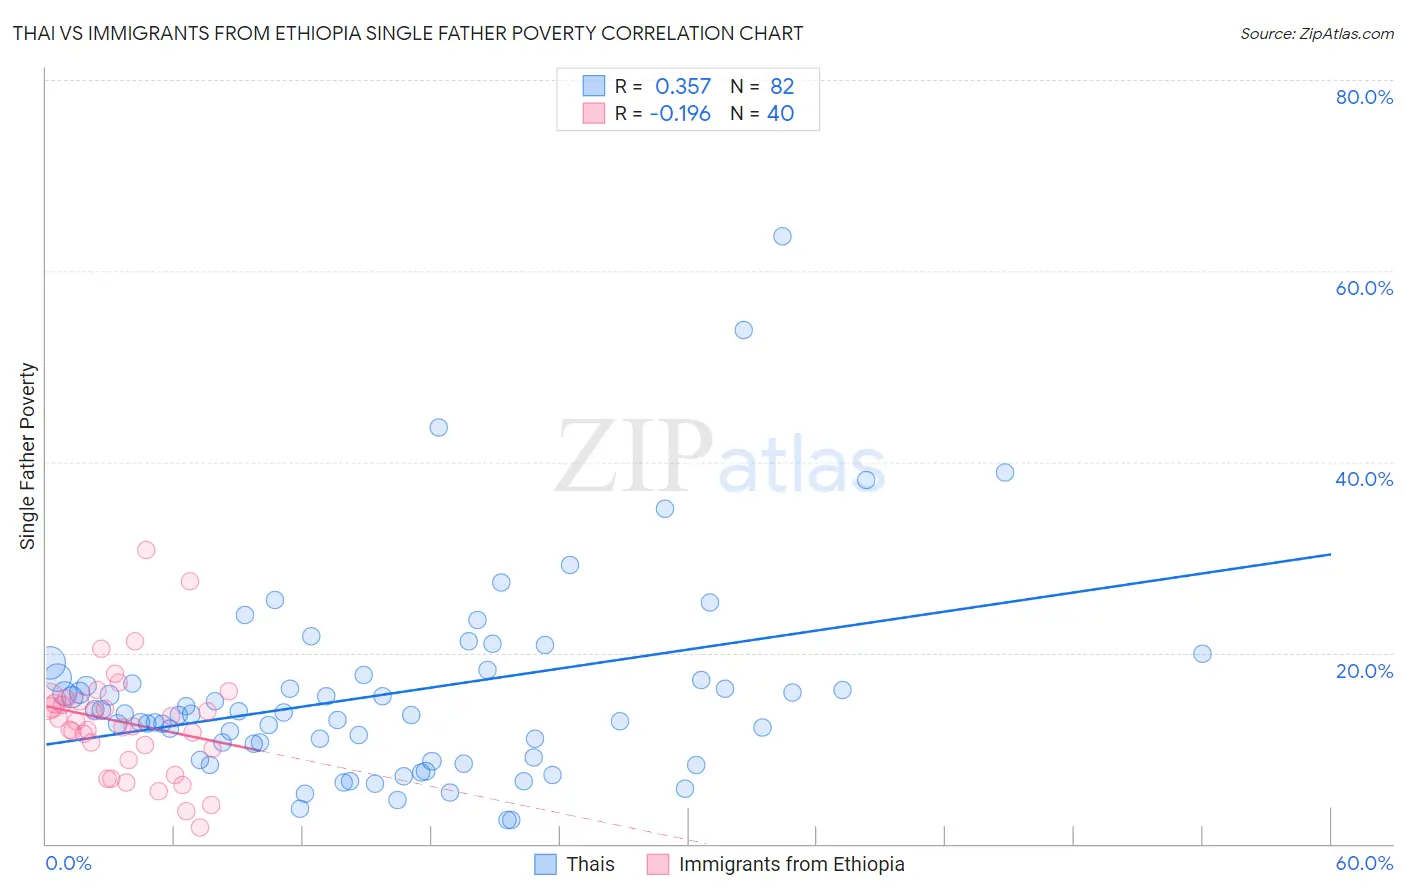
Thai vs Immigrants from Ethiopia Single Father Poverty Correlation Chart
The statistical analysis conducted on geographies consisting of 363,511,447 people shows a mild positive correlation between the proportion of Thais and poverty level among single fathers in the United States with a correlation coefficient (R) of 0.357 and weighted average of 14.5%. Similarly, the statistical analysis conducted on geographies consisting of 182,435,040 people shows a poor negative correlation between the proportion of Immigrants from Ethiopia and poverty level among single fathers in the United States with a correlation coefficient (R) of -0.196 and weighted average of 13.4%, a difference of 8.1%.
Single Father Poverty Correlation Summary
| Measurement | Thai | Immigrants from Ethiopia |
| Minimum | 2.5% | 1.7% |
| Maximum | 63.6% | 30.7% |
| Range | 61.2% | 29.0% |
| Mean | 15.7% | 12.7% |
| Median | 13.6% | 12.6% |
| Interquartile 25% (IQ1) | 9.0% | 9.4% |
| Interquartile 75% (IQ3) | 17.4% | 14.9% |
| Interquartile Range (IQR) | 8.4% | 5.5% |
| Standard Deviation (Sample) | 10.5% | 5.8% |
| Standard Deviation (Population) | 10.4% | 5.8% |
Similar Demographics by Single Father Poverty
Demographics Similar to Thais by Single Father Poverty
In terms of single father poverty, the demographic groups most similar to Thais are Somali (14.5%, a difference of 0.040%), Icelander (14.5%, a difference of 0.080%), Immigrants from South Central Asia (14.5%, a difference of 0.15%), Asian (14.6%, a difference of 0.24%), and Nepalese (14.4%, a difference of 0.68%).
| Demographics | Rating | Rank | Single Father Poverty |
| Immigrants | Egypt | 100.0 /100 | #23 | Exceptional 14.4% |
| Immigrants | South Eastern Asia | 100.0 /100 | #24 | Exceptional 14.4% |
| Iranians | 100.0 /100 | #25 | Exceptional 14.4% |
| Spanish American Indians | 100.0 /100 | #26 | Exceptional 14.4% |
| Nepalese | 100.0 /100 | #27 | Exceptional 14.4% |
| Immigrants | South Central Asia | 100.0 /100 | #28 | Exceptional 14.5% |
| Somalis | 100.0 /100 | #29 | Exceptional 14.5% |
| Thais | 100.0 /100 | #30 | Exceptional 14.5% |
| Icelanders | 100.0 /100 | #31 | Exceptional 14.5% |
| Asians | 100.0 /100 | #32 | Exceptional 14.6% |
| Okinawans | 100.0 /100 | #33 | Exceptional 14.6% |
| Egyptians | 100.0 /100 | #34 | Exceptional 14.7% |
| Immigrants | Bolivia | 100.0 /100 | #35 | Exceptional 14.7% |
| Immigrants | Indonesia | 100.0 /100 | #36 | Exceptional 14.7% |
| Immigrants | Eastern Africa | 100.0 /100 | #37 | Exceptional 14.7% |
Demographics Similar to Immigrants from Ethiopia by Single Father Poverty
In terms of single father poverty, the demographic groups most similar to Immigrants from Ethiopia are Ethiopian (13.5%, a difference of 0.77%), Immigrants from Fiji (13.2%, a difference of 1.6%), Immigrants from Taiwan (13.7%, a difference of 1.8%), Samoan (13.8%, a difference of 2.7%), and Afghan (14.0%, a difference of 3.8%).
| Demographics | Rating | Rank | Single Father Poverty |
| Assyrians/Chaldeans/Syriacs | 100.0 /100 | #1 | Exceptional 11.7% |
| Tongans | 100.0 /100 | #2 | Exceptional 12.2% |
| Tsimshian | 100.0 /100 | #3 | Exceptional 12.7% |
| Immigrants | Fiji | 100.0 /100 | #4 | Exceptional 13.2% |
| Immigrants | Ethiopia | 100.0 /100 | #5 | Exceptional 13.4% |
| Ethiopians | 100.0 /100 | #6 | Exceptional 13.5% |
| Immigrants | Taiwan | 100.0 /100 | #7 | Exceptional 13.7% |
| Samoans | 100.0 /100 | #8 | Exceptional 13.8% |
| Afghans | 100.0 /100 | #9 | Exceptional 14.0% |
| Koreans | 100.0 /100 | #10 | Exceptional 14.0% |
| Filipinos | 100.0 /100 | #11 | Exceptional 14.0% |
| Immigrants | India | 100.0 /100 | #12 | Exceptional 14.0% |
| Immigrants | Philippines | 100.0 /100 | #13 | Exceptional 14.0% |
| Immigrants | Vietnam | 100.0 /100 | #14 | Exceptional 14.1% |
| Sri Lankans | 100.0 /100 | #15 | Exceptional 14.2% |