Taiwanese vs Apache Female Poverty

COMPARE

Taiwanese
Race
Ancestry
AfghanAfricanAlaska NativeAlaskan AthabascanAlbanianAleutAlsatianAmericanArabArapahoArgentineanArmenianAssyrian/Chaldean/SyriacAustralianAustrianBahamianBangladeshiBarbadianBasqueBelgianBelizeanBermudanBhutaneseBlackfeetBolivianBrazilianBritishBritish West IndianBulgarianBurmeseCajunCambodianCanadianCape VerdeanCarpatho RusynCelticCentral AmericanCentral American IndianCherokeeCheyenneChickasawChileanChineseChippewaChoctawColombianColvilleComancheCosta RicanCreeCreekCroatianCrowCubanCypriotCzechCzechoslovakianDanishDelawareDominicanDutchDutch West IndianEastern EuropeanEcuadorianEgyptianEnglishEstonianEthiopianEuropeanFijianFilipinoFinnishFrenchFrench American IndianFrench CanadianGermanGerman RussianGhanaianGreekGuamanian/ChamorroGuatemalanGuyaneseHaitianHmongHonduranHopiHoumaHungarianIcelanderIndian (Asian)IndonesianInupiatIranianIraqiIrishIroquoisIsraeliItalianJamaicanJapaneseJordanianKenyanKiowaKoreanLaotianLatvianLebaneseLiberianLithuanianLumbeeLuxembourgerMacedonianMalaysianMalteseMarshalleseMenomineeMexicanMexican American IndianMongolianMoroccanNative HawaiianNavajoNepaleseNew ZealanderNicaraguanNigerianNorthern EuropeanNorwegianOkinawanOsageOttawaPaiutePakistaniPalestinianPanamanianParaguayanPennsylvania GermanPeruvianPimaPolishPortuguesePotawatomiPuebloPuerto RicanPuget Sound SalishRomanianRussianSalvadoranSamoanScandinavianScotch-IrishScottishSeminoleSenegaleseSerbianShoshoneSierra LeoneanSiouxSlavicSlovakSloveneSomaliSouth AfricanSouth AmericanSouth American IndianSoviet UnionSpaniardSpanishSpanish AmericanSpanish American IndianSri LankanSubsaharan AfricanSudaneseSwedishSwissSyrianTaiwaneseThaiTlingit-HaidaTohono O'OdhamTonganTrinidadian and TobagonianTsimshianTurkishU.S. Virgin IslanderUgandanUkrainianUruguayanUteVenezuelanVietnameseWelshWest IndianYakamaYaquiYugoslavianYumanYup'ikZimbabwean
Immigration
NonimmigrantsImmigrantsAfghanistanAfricaAlbaniaArgentinaArmeniaAsiaAustraliaAustriaBahamasBangladeshBarbadosBelarusBelgiumBelizeBoliviaBosnia and HerzegovinaBrazilBulgariaBurma/MyanmarCabo VerdeCambodiaCameroonCanadaCaribbeanCentral AmericaChileChinaColombiaCongoCosta RicaCroatiaCubaCzechoslovakiaDenmarkDominicaDominican RepublicEastern AfricaEastern AsiaEastern EuropeEcuadorEgyptEl SalvadorEnglandEritreaEthiopiaEuropeFijiFranceGermanyGhanaGreeceGrenadaGuatemalaGuyanaHaitiHondurasHong KongHungaryIndiaIndonesiaIranIraqIrelandIsraelItalyJamaicaJapanJordanKazakhstanKenyaKoreaKuwaitLaosLatin AmericaLatviaLebanonLiberiaLithuaniaMalaysiaMexicoMicronesiaMiddle AfricaMoldovaMoroccoNepalNetherlandsNicaraguaNigeriaNorth AmericaNorth MacedoniaNorthern AfricaNorthern EuropeNorwayOceaniaPakistanPanamaPeruPhilippinesPolandPortugalRomaniaRussiaSaudi ArabiaScotlandSenegalSerbiaSierra LeoneSingaporeSomaliaSouth AfricaSouth AmericaSouth Central AsiaSouth Eastern AsiaSouthern EuropeSpainSri LankaSt. Vincent and the GrenadinesSudanSwedenSwitzerlandSyriaTaiwanThailandTrinidad and TobagoTurkeyUgandaUkraineUruguayUzbekistanVenezuelaVietnamWest IndiesWestern AfricaWestern AsiaWestern EuropeYemenZaireZimbabweAzores
Apache
Race
Ancestry
AfghanAfricanAlaska NativeAlaskan AthabascanAlbanianAleutAlsatianAmericanApacheArabArapahoArgentineanArmenianAssyrian/Chaldean/SyriacAustralianAustrianBahamianBangladeshiBarbadianBasqueBelgianBelizeanBermudanBhutaneseBlackfeetBolivianBrazilianBritishBritish West IndianBulgarianBurmeseCajunCambodianCanadianCape VerdeanCarpatho RusynCelticCentral AmericanCentral American IndianCherokeeCheyenneChickasawChileanChineseChippewaChoctawColombianColvilleComancheCosta RicanCreeCreekCroatianCrowCubanCypriotCzechCzechoslovakianDanishDelawareDominicanDutchDutch West IndianEastern EuropeanEcuadorianEgyptianEnglishEstonianEthiopianEuropeanFijianFilipinoFinnishFrenchFrench American IndianFrench CanadianGermanGerman RussianGhanaianGreekGuamanian/ChamorroGuatemalanGuyaneseHaitianHmongHonduranHopiHoumaHungarianIcelanderIndian (Asian)IndonesianInupiatIranianIraqiIrishIroquoisIsraeliItalianJamaicanJapaneseJordanianKenyanKiowaKoreanLaotianLatvianLebaneseLiberianLithuanianLumbeeLuxembourgerMacedonianMalaysianMalteseMarshalleseMenomineeMexicanMexican American IndianMongolianMoroccanNative HawaiianNavajoNepaleseNew ZealanderNicaraguanNigerianNorthern EuropeanNorwegianOkinawanOsageOttawaPaiutePakistaniPalestinianPanamanianParaguayanPennsylvania GermanPeruvianPimaPolishPortuguesePotawatomiPuebloPuerto RicanPuget Sound SalishRomanianRussianSalvadoranSamoanScandinavianScotch-IrishScottishSeminoleSenegaleseSerbianShoshoneSierra LeoneanSiouxSlavicSlovakSloveneSomaliSouth AfricanSouth AmericanSouth American IndianSoviet UnionSpaniardSpanishSpanish AmericanSpanish American IndianSri LankanSubsaharan AfricanSudaneseSwedishSwissSyrianThaiTlingit-HaidaTohono O'OdhamTonganTrinidadian and TobagonianTsimshianTurkishU.S. Virgin IslanderUgandanUkrainianUruguayanUteVenezuelanVietnameseWelshWest IndianYakamaYaquiYugoslavianYumanYup'ikZimbabwean
Immigration
NonimmigrantsImmigrantsAfghanistanAfricaAlbaniaArgentinaArmeniaAsiaAustraliaAustriaBahamasBangladeshBarbadosBelarusBelgiumBelizeBoliviaBosnia and HerzegovinaBrazilBulgariaBurma/MyanmarCabo VerdeCambodiaCameroonCanadaCaribbeanCentral AmericaChileChinaColombiaCongoCosta RicaCroatiaCubaCzechoslovakiaDenmarkDominicaDominican RepublicEastern AfricaEastern AsiaEastern EuropeEcuadorEgyptEl SalvadorEnglandEritreaEthiopiaEuropeFijiFranceGermanyGhanaGreeceGrenadaGuatemalaGuyanaHaitiHondurasHong KongHungaryIndiaIndonesiaIranIraqIrelandIsraelItalyJamaicaJapanJordanKazakhstanKenyaKoreaKuwaitLaosLatin AmericaLatviaLebanonLiberiaLithuaniaMalaysiaMexicoMicronesiaMiddle AfricaMoldovaMoroccoNepalNetherlandsNicaraguaNigeriaNorth AmericaNorth MacedoniaNorthern AfricaNorthern EuropeNorwayOceaniaPakistanPanamaPeruPhilippinesPolandPortugalRomaniaRussiaSaudi ArabiaScotlandSenegalSerbiaSierra LeoneSingaporeSomaliaSouth AfricaSouth AmericaSouth Central AsiaSouth Eastern AsiaSouthern EuropeSpainSri LankaSt. Vincent and the GrenadinesSudanSwedenSwitzerlandSyriaTaiwanThailandTrinidad and TobagoTurkeyUgandaUkraineUruguayUzbekistanVenezuelaVietnamWest IndiesWestern AfricaWestern AsiaWestern EuropeYemenZaireZimbabweAzores
Female Poverty
Income
Poverty
Unemployment
Labor Participation
Family Structure
Vehicle Availability
Education Level
Disability

Female Poverty Comparison

Taiwanese

Apache

Good
Tragic
13.1%
FEMALE POVERTY
75.7/ 100
METRIC RATING
149th/ 347
METRIC RANK
19.2%
FEMALE POVERTY
0.0/ 100
METRIC RATING
332nd/ 347
METRIC RANK

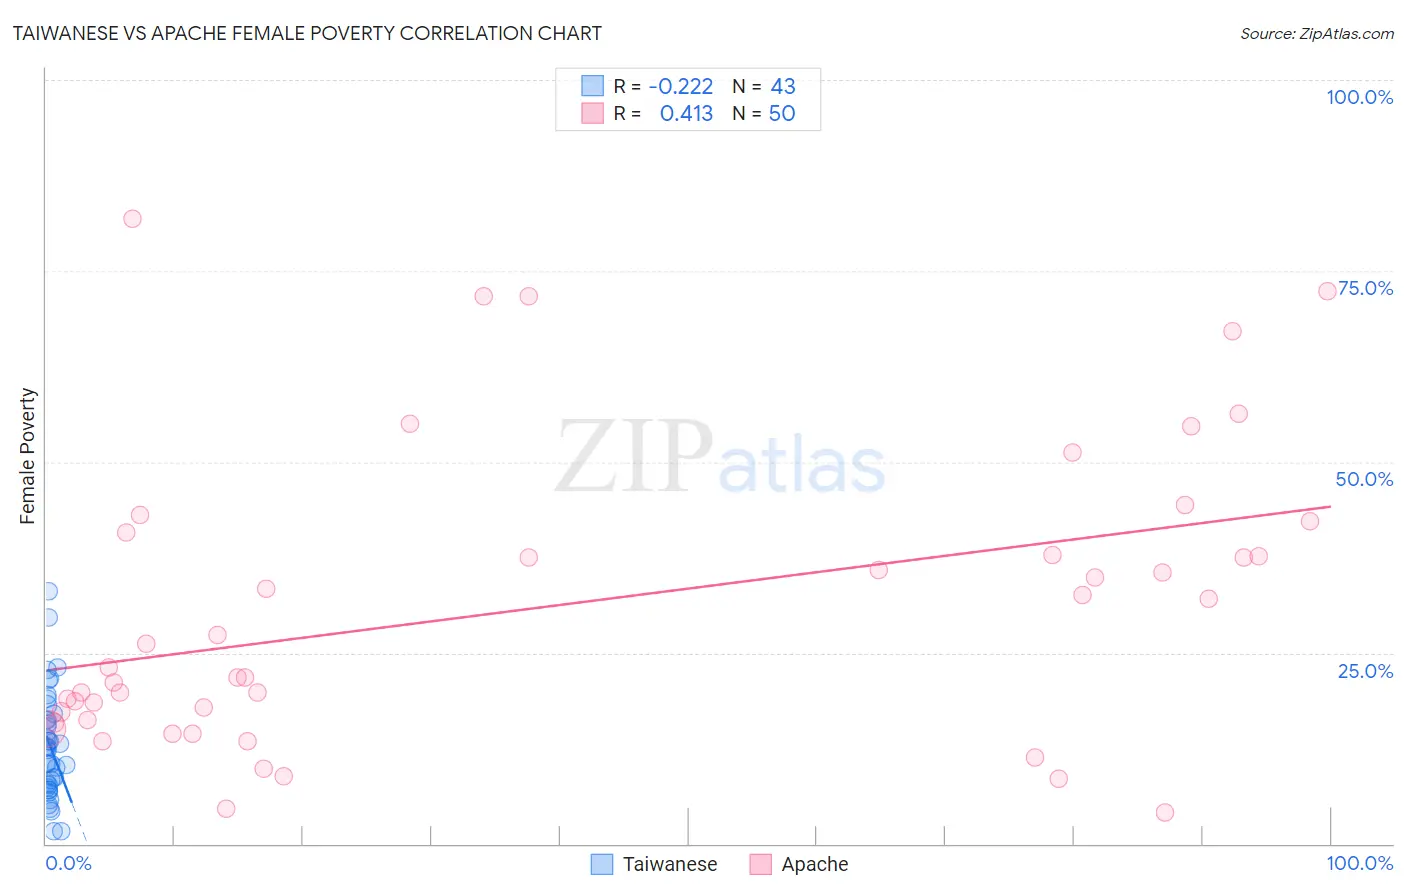
Taiwanese vs Apache Female Poverty Correlation Chart

The statistical analysis conducted on geographies consisting of 31,695,393 people shows a weak negative correlation between the proportion of Taiwanese and poverty level among females in the United States with a correlation coefficient (R) of -0.222 and weighted average of 13.1%. Similarly, the statistical analysis conducted on geographies consisting of 230,999,825 people shows a moderate positive correlation between the proportion of Apache and poverty level among females in the United States with a correlation coefficient (R) of 0.413 and weighted average of 19.2%, a difference of 47.1%.
Taiwanese vs Apache Female Poverty

Female Poverty Correlation Summary

MeasurementTaiwaneseApache
Minimum1.6%4.1%
Maximum33.0%81.8%
Range31.4%77.7%
Mean12.8%31.0%
Median12.6%24.6%
Interquartile 25% (IQ1)7.7%16.2%
Interquartile 75% (IQ3)16.3%40.7%
Interquartile Range (IQR)8.6%24.5%
Standard Deviation (Sample)6.9%19.5%
Standard Deviation (Population)6.8%19.3%

Similar Demographics by Female Poverty

Demographics Similar to Taiwanese by Female Poverty

In terms of female poverty, the demographic groups most similar to Taiwanese are Tsimshian (13.1%, a difference of 0.030%), Immigrants from Germany (13.1%, a difference of 0.10%), Yugoslavian (13.1%, a difference of 0.16%), Samoan (13.1%, a difference of 0.27%), and Immigrants from Kazakhstan (13.0%, a difference of 0.41%).
DemographicsRating | RankFemale Poverty
Brazilians
80.5
/100
|
#142
Excellent
13.0%
Immigrants | Malaysia
80.4
/100
|
#143
Excellent
13.0%
Afghans
79.8
/100
|
#144
Good
13.0%
Syrians
79.6
/100
|
#145
Good
13.0%
Immigrants | Peru
79.1
/100
|
#146
Good
13.0%
Immigrants | Kazakhstan
78.6
/100
|
#147
Good
13.0%
Yugoslavians
76.9
/100
|
#148
Good
13.1%
Taiwanese
75.7
/100
|
#149
Good
13.1%
Tsimshian
75.5
/100
|
#150
Good
13.1%
Immigrants | Germany
74.9
/100
|
#151
Good
13.1%
Samoans
73.6
/100
|
#152
Good
13.1%
Immigrants | Fiji
71.0
/100
|
#153
Good
13.2%
Armenians
70.4
/100
|
#154
Good
13.2%
Hungarians
70.1
/100
|
#155
Good
13.2%
Immigrants | Bosnia and Herzegovina
69.7
/100
|
#156
Good
13.2%

Demographics Similar to Apache by Female Poverty

In terms of female poverty, the demographic groups most similar to Apache are Native/Alaskan (19.2%, a difference of 0.16%), Dominican (19.1%, a difference of 0.58%), Immigrants from Dominican Republic (19.3%, a difference of 0.60%), Kiowa (18.6%, a difference of 3.3%), and Black/African American (18.6%, a difference of 3.5%).
DemographicsRating | RankFemale Poverty
Colville
0.0
/100
|
#325
Tragic
17.8%
Central American Indians
0.0
/100
|
#326
Tragic
18.0%
Yakama
0.0
/100
|
#327
Tragic
18.0%
Blacks/African Americans
0.0
/100
|
#328
Tragic
18.6%
Kiowa
0.0
/100
|
#329
Tragic
18.6%
Dominicans
0.0
/100
|
#330
Tragic
19.1%
Natives/Alaskans
0.0
/100
|
#331
Tragic
19.2%
Apache
0.0
/100
|
#332
Tragic
19.2%
Immigrants | Dominican Republic
0.0
/100
|
#333
Tragic
19.3%
Houma
0.0
/100
|
#334
Tragic
20.0%
Cheyenne
0.0
/100
|
#335
Tragic
20.2%
Pueblo
0.0
/100
|
#336
Tragic
20.7%
Yuman
0.0
/100
|
#337
Tragic
20.8%
Sioux
0.0
/100
|
#338
Tragic
20.9%
Hopi
0.0
/100
|
#339
Tragic
21.0%