Taiwanese vs Aleut Single Male Poverty
COMPARE
Taiwanese
Aleut
Single Male Poverty
Single Male Poverty Comparison
Taiwanese
Aleuts
10.9%
SINGLE MALE POVERTY
100.0/ 100
METRIC RATING
9th/ 347
METRIC RANK
15.4%
SINGLE MALE POVERTY
0.0/ 100
METRIC RATING
303rd/ 347
METRIC RANK
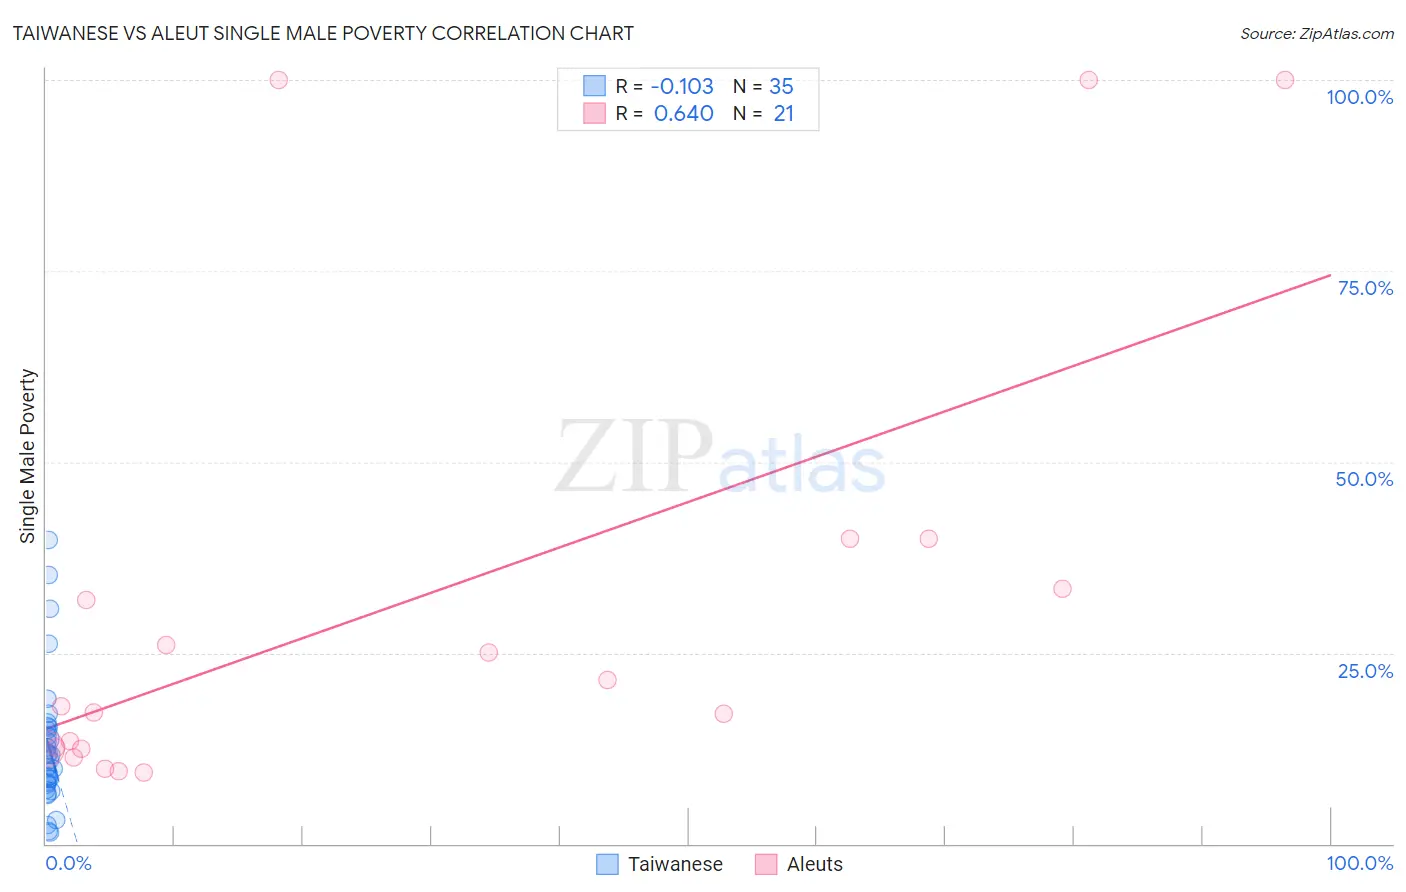
Taiwanese vs Aleut Single Male Poverty Correlation Chart
The statistical analysis conducted on geographies consisting of 31,221,871 people shows a poor negative correlation between the proportion of Taiwanese and poverty level among single males in the United States with a correlation coefficient (R) of -0.103 and weighted average of 10.9%. Similarly, the statistical analysis conducted on geographies consisting of 59,537,447 people shows a significant positive correlation between the proportion of Aleuts and poverty level among single males in the United States with a correlation coefficient (R) of 0.640 and weighted average of 15.4%, a difference of 41.4%.
Single Male Poverty Correlation Summary
| Measurement | Taiwanese | Aleut |
| Minimum | 1.4% | 9.3% |
| Maximum | 39.7% | 100.0% |
| Range | 38.3% | 90.7% |
| Mean | 12.8% | 31.5% |
| Median | 11.6% | 18.0% |
| Interquartile 25% (IQ1) | 7.8% | 12.5% |
| Interquartile 75% (IQ3) | 15.3% | 36.7% |
| Interquartile Range (IQR) | 7.4% | 24.2% |
| Standard Deviation (Sample) | 8.7% | 30.2% |
| Standard Deviation (Population) | 8.5% | 29.5% |
Similar Demographics by Single Male Poverty
Demographics Similar to Taiwanese by Single Male Poverty
In terms of single male poverty, the demographic groups most similar to Taiwanese are Immigrants from Fiji (10.9%, a difference of 0.050%), Immigrants from Philippines (10.9%, a difference of 0.070%), Immigrants from Afghanistan (10.9%, a difference of 0.15%), Immigrants from South Central Asia (10.9%, a difference of 0.27%), and Chinese (11.0%, a difference of 0.84%).
| Demographics | Rating | Rank | Single Male Poverty |
| Immigrants | Taiwan | 100.0 /100 | #2 | Exceptional 10.3% |
| Immigrants | India | 100.0 /100 | #3 | Exceptional 10.3% |
| Immigrants | Hong Kong | 100.0 /100 | #4 | Exceptional 10.4% |
| Tongans | 100.0 /100 | #5 | Exceptional 10.5% |
| Filipinos | 100.0 /100 | #6 | Exceptional 10.6% |
| Afghans | 100.0 /100 | #7 | Exceptional 10.7% |
| Thais | 100.0 /100 | #8 | Exceptional 10.8% |
| Taiwanese | 100.0 /100 | #9 | Exceptional 10.9% |
| Immigrants | Fiji | 100.0 /100 | #10 | Exceptional 10.9% |
| Immigrants | Philippines | 100.0 /100 | #11 | Exceptional 10.9% |
| Immigrants | Afghanistan | 100.0 /100 | #12 | Exceptional 10.9% |
| Immigrants | South Central Asia | 100.0 /100 | #13 | Exceptional 10.9% |
| Chinese | 100.0 /100 | #14 | Exceptional 11.0% |
| Koreans | 100.0 /100 | #15 | Exceptional 11.0% |
| Bhutanese | 100.0 /100 | #16 | Exceptional 11.1% |
Demographics Similar to Aleuts by Single Male Poverty
In terms of single male poverty, the demographic groups most similar to Aleuts are Alaska Native (15.4%, a difference of 0.11%), Blackfeet (15.5%, a difference of 0.64%), Alsatian (15.2%, a difference of 1.0%), Pennsylvania German (15.6%, a difference of 1.1%), and Dominican (15.2%, a difference of 1.2%).
| Demographics | Rating | Rank | Single Male Poverty |
| Africans | 0.0 /100 | #296 | Tragic 14.7% |
| Immigrants | Dominican Republic | 0.0 /100 | #297 | Tragic 14.8% |
| French American Indians | 0.0 /100 | #298 | Tragic 15.0% |
| Delaware | 0.0 /100 | #299 | Tragic 15.0% |
| Cree | 0.0 /100 | #300 | Tragic 15.1% |
| Dominicans | 0.0 /100 | #301 | Tragic 15.2% |
| Alsatians | 0.0 /100 | #302 | Tragic 15.2% |
| Aleuts | 0.0 /100 | #303 | Tragic 15.4% |
| Alaska Natives | 0.0 /100 | #304 | Tragic 15.4% |
| Blackfeet | 0.0 /100 | #305 | Tragic 15.5% |
| Pennsylvania Germans | 0.0 /100 | #306 | Tragic 15.6% |
| Ute | 0.0 /100 | #307 | Tragic 15.7% |
| Potawatomi | 0.0 /100 | #308 | Tragic 15.8% |
| Americans | 0.0 /100 | #309 | Tragic 15.8% |
| Yakama | 0.0 /100 | #310 | Tragic 15.9% |