Syrian vs Pima Single Father Poverty
COMPARE
Syrian
Pima
Single Father Poverty
Single Father Poverty Comparison
Syrians
Pima
16.6%
SINGLE FATHER POVERTY
17.4/ 100
METRIC RATING
200th/ 347
METRIC RANK
14.8%
SINGLE FATHER POVERTY
100.0/ 100
METRIC RATING
40th/ 347
METRIC RANK
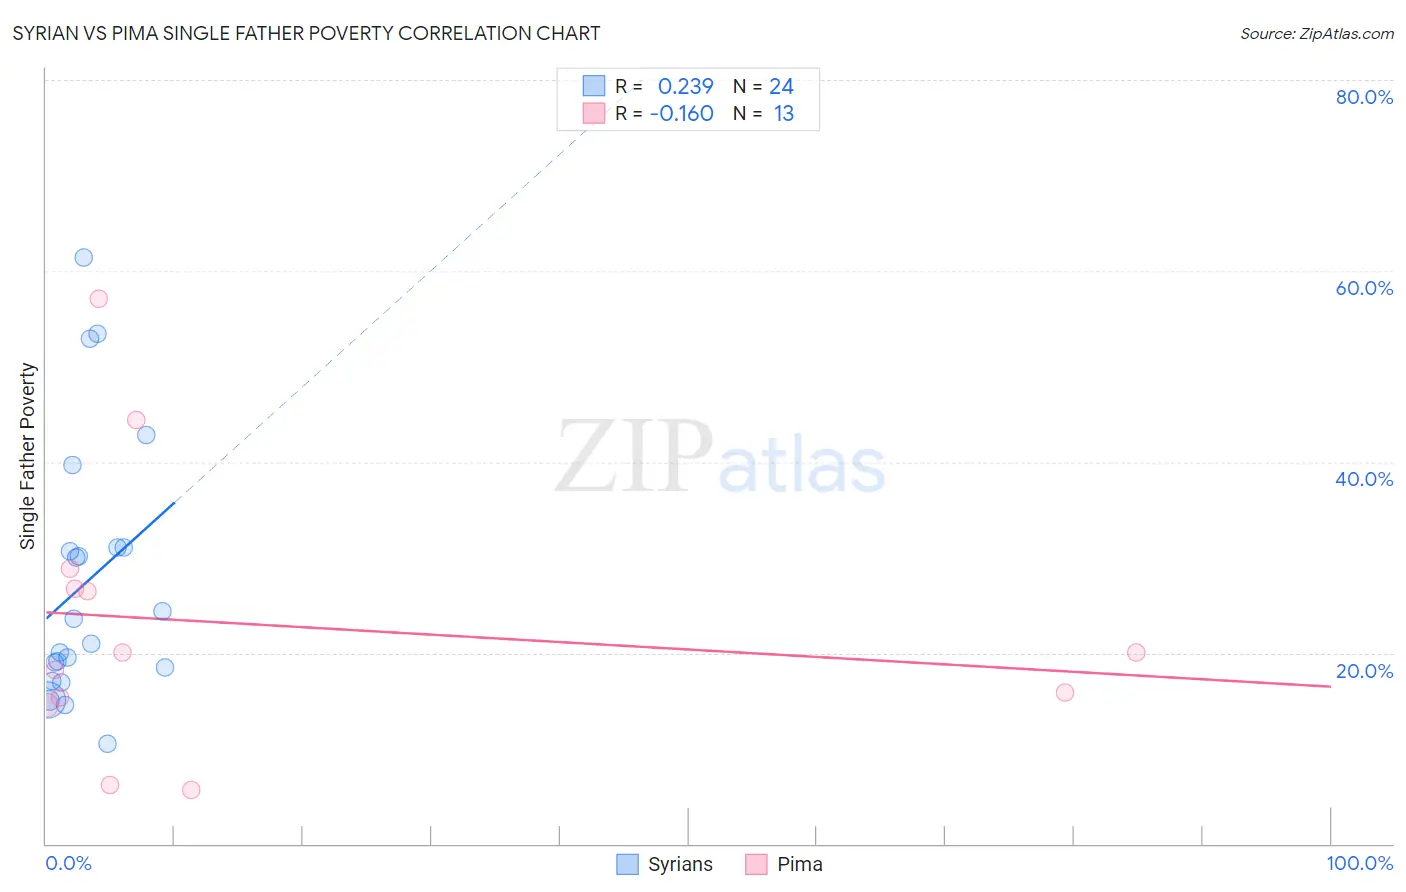
Syrian vs Pima Single Father Poverty Correlation Chart
The statistical analysis conducted on geographies consisting of 216,304,035 people shows a weak positive correlation between the proportion of Syrians and poverty level among single fathers in the United States with a correlation coefficient (R) of 0.239 and weighted average of 16.6%. Similarly, the statistical analysis conducted on geographies consisting of 58,926,282 people shows a poor negative correlation between the proportion of Pima and poverty level among single fathers in the United States with a correlation coefficient (R) of -0.160 and weighted average of 14.8%, a difference of 12.2%.
Single Father Poverty Correlation Summary
| Measurement | Syrian | Pima |
| Minimum | 10.4% | 5.6% |
| Maximum | 61.3% | 57.1% |
| Range | 50.9% | 51.6% |
| Mean | 27.4% | 23.0% |
| Median | 22.2% | 20.0% |
| Interquartile 25% (IQ1) | 17.7% | 14.9% |
| Interquartile 75% (IQ3) | 31.0% | 27.7% |
| Interquartile Range (IQR) | 13.3% | 12.9% |
| Standard Deviation (Sample) | 13.7% | 14.4% |
| Standard Deviation (Population) | 13.4% | 13.9% |
Similar Demographics by Single Father Poverty
Demographics Similar to Syrians by Single Father Poverty
In terms of single father poverty, the demographic groups most similar to Syrians are Cuban (16.6%, a difference of 0.070%), Immigrants from Croatia (16.6%, a difference of 0.070%), Immigrants from Belize (16.5%, a difference of 0.17%), Romanian (16.5%, a difference of 0.19%), and Immigrants from North America (16.6%, a difference of 0.19%).
| Demographics | Rating | Rank | Single Father Poverty |
| Ecuadorians | 24.5 /100 | #193 | Fair 16.5% |
| Cape Verdeans | 24.4 /100 | #194 | Fair 16.5% |
| Immigrants | Barbados | 24.3 /100 | #195 | Fair 16.5% |
| Immigrants | Canada | 21.9 /100 | #196 | Fair 16.5% |
| Immigrants | Northern Europe | 20.3 /100 | #197 | Fair 16.5% |
| Romanians | 20.1 /100 | #198 | Fair 16.5% |
| Immigrants | Belize | 19.8 /100 | #199 | Poor 16.5% |
| Syrians | 17.4 /100 | #200 | Poor 16.6% |
| Cubans | 16.5 /100 | #201 | Poor 16.6% |
| Immigrants | Croatia | 16.5 /100 | #202 | Poor 16.6% |
| Immigrants | North America | 15.1 /100 | #203 | Poor 16.6% |
| Immigrants | Guatemala | 14.8 /100 | #204 | Poor 16.6% |
| Venezuelans | 14.3 /100 | #205 | Poor 16.6% |
| Immigrants | Senegal | 13.7 /100 | #206 | Poor 16.6% |
| New Zealanders | 13.7 /100 | #207 | Poor 16.6% |
Demographics Similar to Pima by Single Father Poverty
In terms of single father poverty, the demographic groups most similar to Pima are Indian (Asian) (14.8%, a difference of 0.17%), Immigrants from Nepal (14.8%, a difference of 0.17%), Immigrants from Asia (14.7%, a difference of 0.20%), Immigrants from Eritrea (14.8%, a difference of 0.21%), and Bolivian (14.7%, a difference of 0.37%).
| Demographics | Rating | Rank | Single Father Poverty |
| Okinawans | 100.0 /100 | #33 | Exceptional 14.6% |
| Egyptians | 100.0 /100 | #34 | Exceptional 14.7% |
| Immigrants | Bolivia | 100.0 /100 | #35 | Exceptional 14.7% |
| Immigrants | Indonesia | 100.0 /100 | #36 | Exceptional 14.7% |
| Immigrants | Eastern Africa | 100.0 /100 | #37 | Exceptional 14.7% |
| Bolivians | 100.0 /100 | #38 | Exceptional 14.7% |
| Immigrants | Asia | 100.0 /100 | #39 | Exceptional 14.7% |
| Pima | 100.0 /100 | #40 | Exceptional 14.8% |
| Indians (Asian) | 100.0 /100 | #41 | Exceptional 14.8% |
| Immigrants | Nepal | 100.0 /100 | #42 | Exceptional 14.8% |
| Immigrants | Eritrea | 100.0 /100 | #43 | Exceptional 14.8% |
| Salvadorans | 100.0 /100 | #44 | Exceptional 14.9% |
| Immigrants | Somalia | 100.0 /100 | #45 | Exceptional 14.9% |
| Immigrants | Cambodia | 99.9 /100 | #46 | Exceptional 14.9% |
| Immigrants | China | 99.9 /100 | #47 | Exceptional 14.9% |