Syrian vs Immigrants from Micronesia Single Female Poverty
COMPARE
Syrian
Immigrants from Micronesia
Single Female Poverty
Single Female Poverty Comparison
Syrians
Immigrants from Micronesia
20.3%
SINGLE FEMALE POVERTY
90.4/ 100
METRIC RATING
140th/ 347
METRIC RANK
23.0%
SINGLE FEMALE POVERTY
0.2/ 100
METRIC RATING
266th/ 347
METRIC RANK
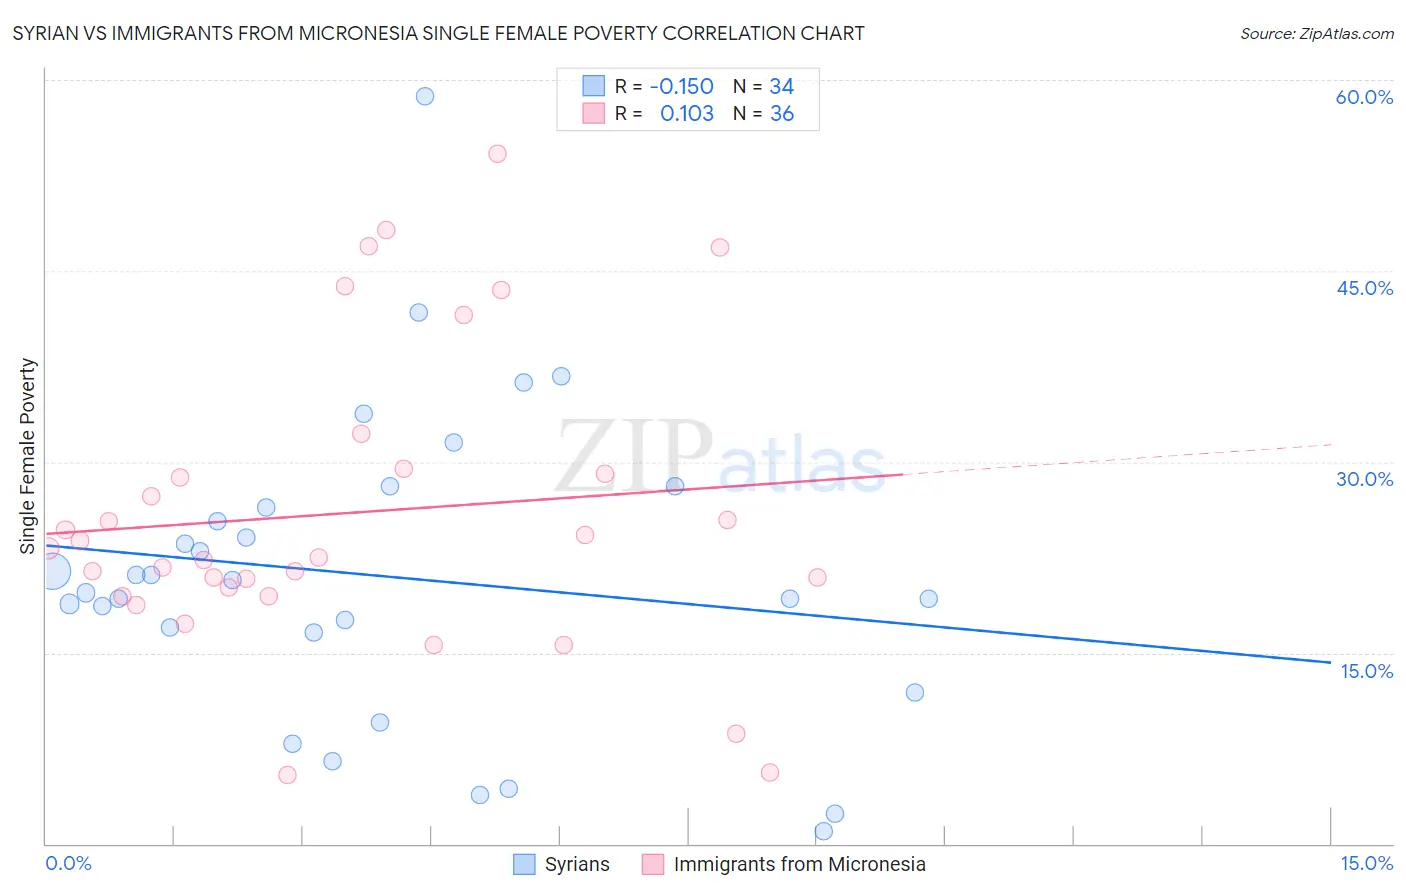
Syrian vs Immigrants from Micronesia Single Female Poverty Correlation Chart
The statistical analysis conducted on geographies consisting of 263,006,420 people shows a poor negative correlation between the proportion of Syrians and poverty level among single females in the United States with a correlation coefficient (R) of -0.150 and weighted average of 20.3%. Similarly, the statistical analysis conducted on geographies consisting of 61,492,731 people shows a poor positive correlation between the proportion of Immigrants from Micronesia and poverty level among single females in the United States with a correlation coefficient (R) of 0.103 and weighted average of 23.0%, a difference of 13.6%.
Single Female Poverty Correlation Summary
| Measurement | Syrian | Immigrants from Micronesia |
| Minimum | 0.97% | 5.4% |
| Maximum | 58.7% | 54.2% |
| Range | 57.7% | 48.7% |
| Mean | 21.0% | 26.0% |
| Median | 20.2% | 22.8% |
| Interquartile 25% (IQ1) | 16.6% | 19.8% |
| Interquartile 75% (IQ3) | 26.4% | 29.2% |
| Interquartile Range (IQR) | 9.8% | 9.4% |
| Standard Deviation (Sample) | 12.0% | 11.8% |
| Standard Deviation (Population) | 11.8% | 11.6% |
Similar Demographics by Single Female Poverty
Demographics Similar to Syrians by Single Female Poverty
In terms of single female poverty, the demographic groups most similar to Syrians are Slovene (20.3%, a difference of 0.010%), Immigrants from Kuwait (20.3%, a difference of 0.010%), Immigrants from Nepal (20.3%, a difference of 0.050%), Immigrants from North America (20.3%, a difference of 0.15%), and Immigrants from Iraq (20.2%, a difference of 0.16%).
| Demographics | Rating | Rank | Single Female Poverty |
| Immigrants | England | 91.9 /100 | #133 | Exceptional 20.2% |
| Immigrants | Venezuela | 91.5 /100 | #134 | Exceptional 20.2% |
| Immigrants | Iraq | 91.2 /100 | #135 | Exceptional 20.2% |
| Immigrants | Canada | 91.2 /100 | #136 | Exceptional 20.2% |
| Immigrants | Nepal | 90.6 /100 | #137 | Exceptional 20.3% |
| Slovenes | 90.5 /100 | #138 | Exceptional 20.3% |
| Immigrants | Kuwait | 90.4 /100 | #139 | Exceptional 20.3% |
| Syrians | 90.4 /100 | #140 | Exceptional 20.3% |
| Immigrants | North America | 89.5 /100 | #141 | Excellent 20.3% |
| Immigrants | Uganda | 89.1 /100 | #142 | Excellent 20.3% |
| Australians | 88.4 /100 | #143 | Excellent 20.3% |
| Immigrants | Uzbekistan | 88.3 /100 | #144 | Excellent 20.3% |
| Austrians | 85.8 /100 | #145 | Excellent 20.4% |
| Venezuelans | 85.5 /100 | #146 | Excellent 20.4% |
| South Africans | 85.3 /100 | #147 | Excellent 20.4% |
Demographics Similar to Immigrants from Micronesia by Single Female Poverty
In terms of single female poverty, the demographic groups most similar to Immigrants from Micronesia are Senegalese (23.0%, a difference of 0.060%), Fijian (23.1%, a difference of 0.13%), Hmong (23.1%, a difference of 0.16%), Central American (23.0%, a difference of 0.21%), and Immigrants from Laos (22.9%, a difference of 0.38%).
| Demographics | Rating | Rank | Single Female Poverty |
| Whites/Caucasians | 0.6 /100 | #259 | Tragic 22.7% |
| Celtics | 0.5 /100 | #260 | Tragic 22.7% |
| Immigrants | Cabo Verde | 0.4 /100 | #261 | Tragic 22.8% |
| British West Indians | 0.4 /100 | #262 | Tragic 22.8% |
| Scotch-Irish | 0.3 /100 | #263 | Tragic 22.9% |
| Immigrants | Laos | 0.3 /100 | #264 | Tragic 22.9% |
| Central Americans | 0.2 /100 | #265 | Tragic 23.0% |
| Immigrants | Micronesia | 0.2 /100 | #266 | Tragic 23.0% |
| Senegalese | 0.2 /100 | #267 | Tragic 23.0% |
| Fijians | 0.2 /100 | #268 | Tragic 23.1% |
| Hmong | 0.2 /100 | #269 | Tragic 23.1% |
| Inupiat | 0.2 /100 | #270 | Tragic 23.1% |
| Sub-Saharan Africans | 0.1 /100 | #271 | Tragic 23.2% |
| Immigrants | Senegal | 0.1 /100 | #272 | Tragic 23.2% |
| Alaska Natives | 0.1 /100 | #273 | Tragic 23.3% |