Syrian vs Immigrants from Fiji Seniors Poverty Over the Age of 75
COMPARE
Syrian
Immigrants from Fiji
Seniors Poverty Over the Age of 75
Seniors Poverty Over the Age of 75 Comparison
Syrians
Immigrants from Fiji
11.6%
SENIORS POVERTY OVER THE AGE OF 75
91.1/ 100
METRIC RATING
100th/ 347
METRIC RANK
12.2%
SENIORS POVERTY OVER THE AGE OF 75
51.5/ 100
METRIC RATING
172nd/ 347
METRIC RANK
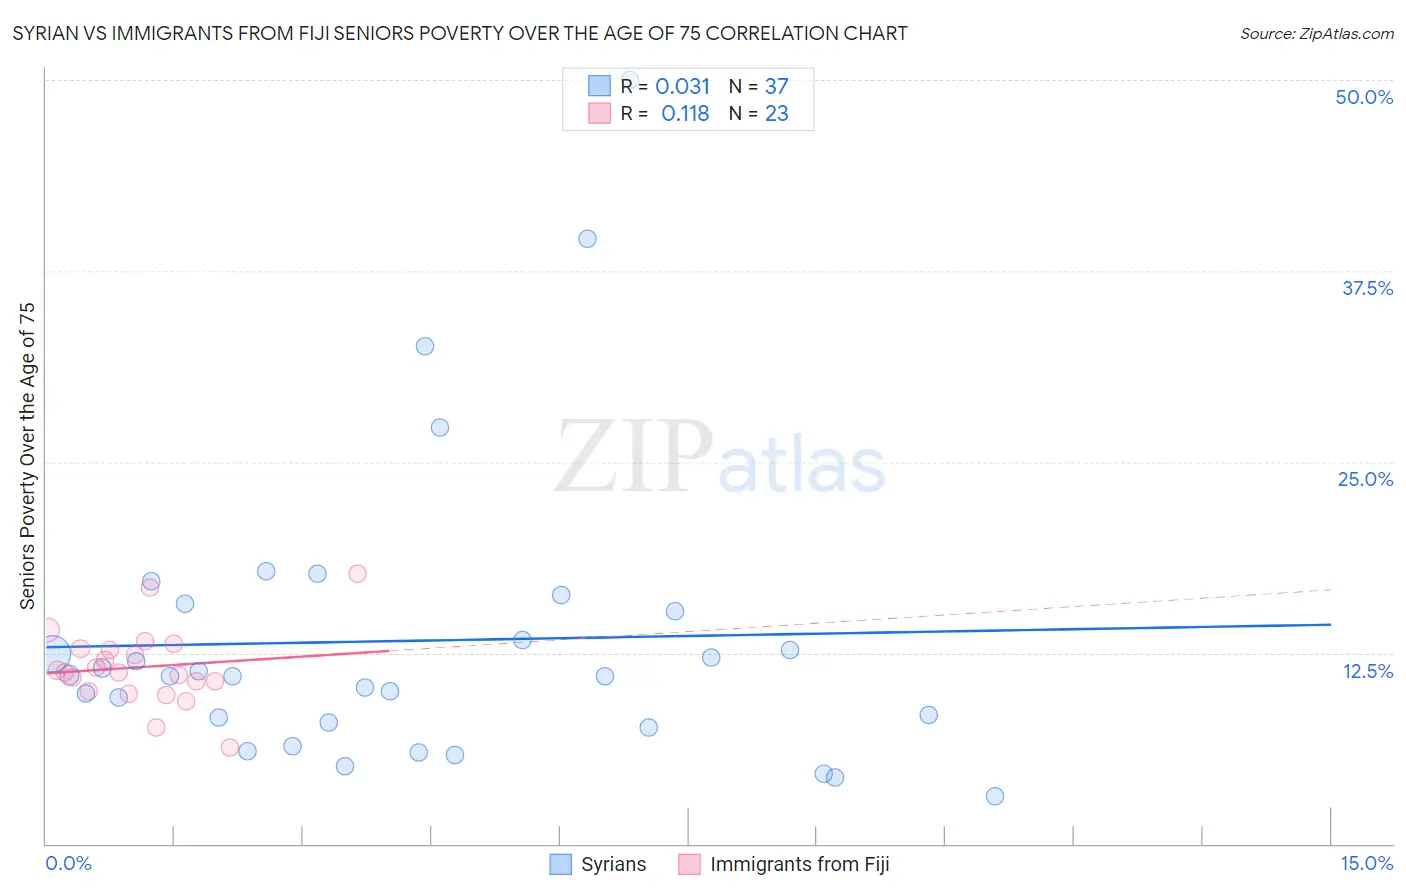
Syrian vs Immigrants from Fiji Seniors Poverty Over the Age of 75 Correlation Chart
The statistical analysis conducted on geographies consisting of 264,328,222 people shows no correlation between the proportion of Syrians and poverty level among seniors over the age of 75 in the United States with a correlation coefficient (R) of 0.031 and weighted average of 11.6%. Similarly, the statistical analysis conducted on geographies consisting of 93,526,881 people shows a poor positive correlation between the proportion of Immigrants from Fiji and poverty level among seniors over the age of 75 in the United States with a correlation coefficient (R) of 0.118 and weighted average of 12.2%, a difference of 4.8%.
Seniors Poverty Over the Age of 75 Correlation Summary
| Measurement | Syrian | Immigrants from Fiji |
| Minimum | 3.1% | 6.3% |
| Maximum | 50.0% | 17.7% |
| Range | 46.9% | 11.4% |
| Mean | 13.3% | 11.6% |
| Median | 11.0% | 11.2% |
| Interquartile 25% (IQ1) | 7.8% | 10.0% |
| Interquartile 75% (IQ3) | 15.5% | 12.8% |
| Interquartile Range (IQR) | 7.7% | 2.8% |
| Standard Deviation (Sample) | 9.7% | 2.5% |
| Standard Deviation (Population) | 9.6% | 2.5% |
Similar Demographics by Seniors Poverty Over the Age of 75
Demographics Similar to Syrians by Seniors Poverty Over the Age of 75
In terms of seniors poverty over the age of 75, the demographic groups most similar to Syrians are Jordanian (11.6%, a difference of 0.080%), Guamanian/Chamorro (11.6%, a difference of 0.12%), Immigrants from Ethiopia (11.6%, a difference of 0.16%), Immigrants from Kuwait (11.6%, a difference of 0.16%), and Immigrants from Singapore (11.6%, a difference of 0.21%).
| Demographics | Rating | Rank | Seniors Poverty Over the Age of 75 |
| Immigrants | Poland | 92.9 /100 | #93 | Exceptional 11.6% |
| Creek | 92.7 /100 | #94 | Exceptional 11.6% |
| Immigrants | Bosnia and Herzegovina | 92.6 /100 | #95 | Exceptional 11.6% |
| Immigrants | Sweden | 92.6 /100 | #96 | Exceptional 11.6% |
| Romanians | 92.3 /100 | #97 | Exceptional 11.6% |
| Immigrants | Japan | 91.9 /100 | #98 | Exceptional 11.6% |
| Immigrants | Ethiopia | 91.7 /100 | #99 | Exceptional 11.6% |
| Syrians | 91.1 /100 | #100 | Exceptional 11.6% |
| Jordanians | 90.8 /100 | #101 | Exceptional 11.6% |
| Guamanians/Chamorros | 90.6 /100 | #102 | Exceptional 11.6% |
| Immigrants | Kuwait | 90.5 /100 | #103 | Exceptional 11.6% |
| Immigrants | Singapore | 90.3 /100 | #104 | Exceptional 11.6% |
| Chickasaw | 90.2 /100 | #105 | Exceptional 11.6% |
| Russians | 89.9 /100 | #106 | Excellent 11.6% |
| Immigrants | Oceania | 89.4 /100 | #107 | Excellent 11.7% |
Demographics Similar to Immigrants from Fiji by Seniors Poverty Over the Age of 75
In terms of seniors poverty over the age of 75, the demographic groups most similar to Immigrants from Fiji are Spaniard (12.2%, a difference of 0.010%), Immigrants from Thailand (12.2%, a difference of 0.040%), Arab (12.2%, a difference of 0.080%), Immigrants from Europe (12.2%, a difference of 0.12%), and Immigrants from Saudi Arabia (12.2%, a difference of 0.17%).
| Demographics | Rating | Rank | Seniors Poverty Over the Age of 75 |
| Okinawans | 56.3 /100 | #165 | Average 12.1% |
| Egyptians | 54.8 /100 | #166 | Average 12.1% |
| Immigrants | Switzerland | 54.5 /100 | #167 | Average 12.1% |
| Immigrants | Syria | 53.9 /100 | #168 | Average 12.2% |
| Immigrants | Egypt | 53.7 /100 | #169 | Average 12.2% |
| Immigrants | Thailand | 52.0 /100 | #170 | Average 12.2% |
| Spaniards | 51.6 /100 | #171 | Average 12.2% |
| Immigrants | Fiji | 51.5 /100 | #172 | Average 12.2% |
| Arabs | 50.5 /100 | #173 | Average 12.2% |
| Immigrants | Europe | 50.0 /100 | #174 | Average 12.2% |
| Immigrants | Saudi Arabia | 49.5 /100 | #175 | Average 12.2% |
| Immigrants | Iran | 48.1 /100 | #176 | Average 12.2% |
| Immigrants | Asia | 47.8 /100 | #177 | Average 12.2% |
| Immigrants | Nonimmigrants | 46.8 /100 | #178 | Average 12.2% |
| Mongolians | 45.5 /100 | #179 | Average 12.2% |