Swiss vs Immigrants from Nicaragua Single Mother Poverty
COMPARE
Swiss
Immigrants from Nicaragua
Single Mother Poverty
Single Mother Poverty Comparison
Swiss
Immigrants from Nicaragua
29.7%
SINGLE MOTHER POVERTY
17.2/ 100
METRIC RATING
203rd/ 347
METRIC RANK
30.3%
SINGLE MOTHER POVERTY
3.5/ 100
METRIC RATING
234th/ 347
METRIC RANK
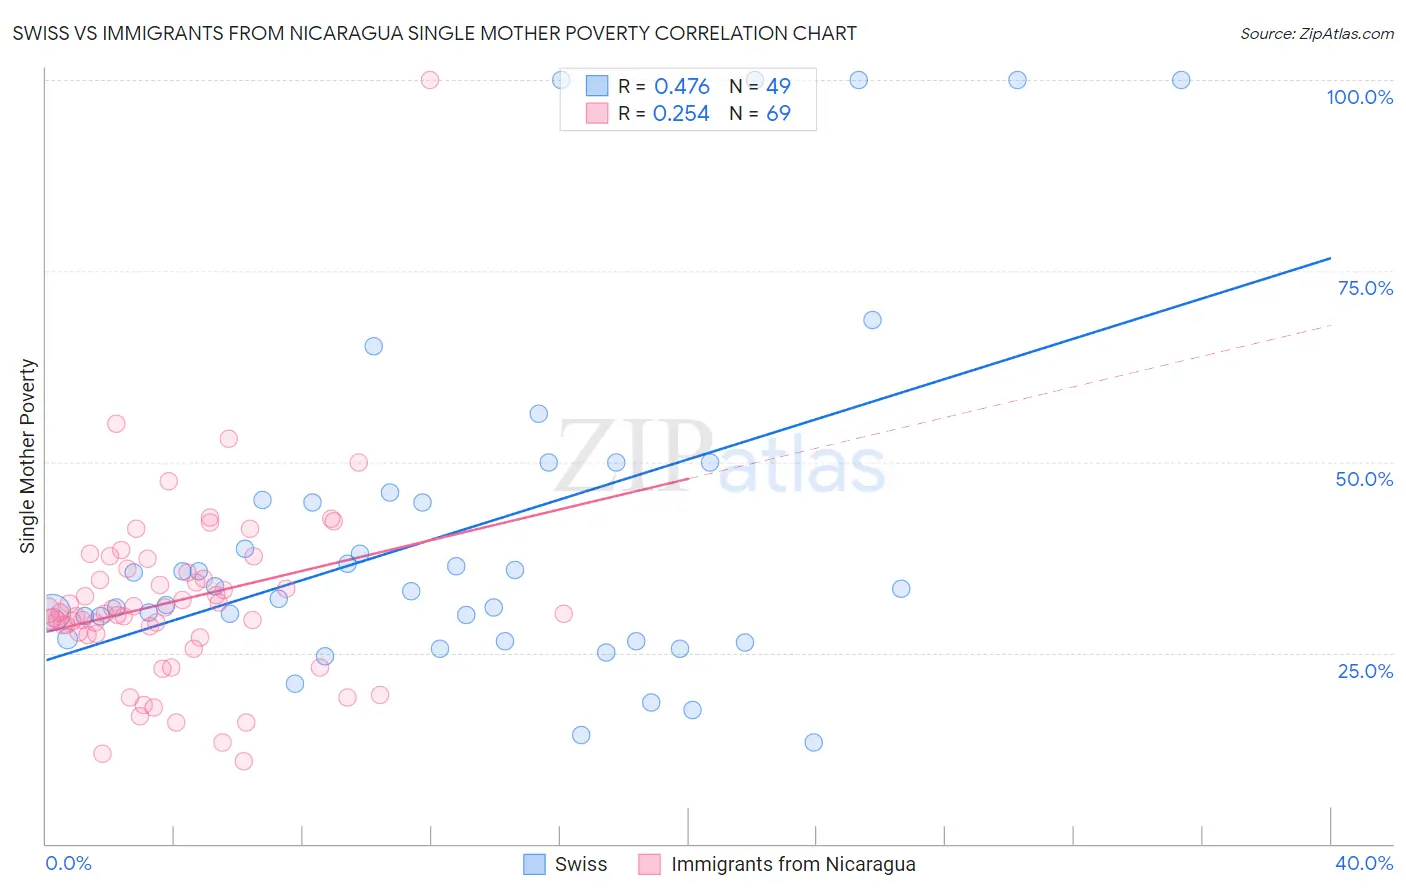
Swiss vs Immigrants from Nicaragua Single Mother Poverty Correlation Chart
The statistical analysis conducted on geographies consisting of 448,256,315 people shows a moderate positive correlation between the proportion of Swiss and poverty level among single mothers in the United States with a correlation coefficient (R) of 0.476 and weighted average of 29.7%. Similarly, the statistical analysis conducted on geographies consisting of 234,135,919 people shows a weak positive correlation between the proportion of Immigrants from Nicaragua and poverty level among single mothers in the United States with a correlation coefficient (R) of 0.254 and weighted average of 30.3%, a difference of 2.1%.
Single Mother Poverty Correlation Summary
| Measurement | Swiss | Immigrants from Nicaragua |
| Minimum | 13.3% | 10.8% |
| Maximum | 100.0% | 100.0% |
| Range | 86.7% | 89.2% |
| Mean | 41.0% | 31.7% |
| Median | 33.3% | 30.2% |
| Interquartile 25% (IQ1) | 26.7% | 27.4% |
| Interquartile 75% (IQ3) | 45.5% | 35.7% |
| Interquartile Range (IQR) | 18.8% | 8.3% |
| Standard Deviation (Sample) | 23.1% | 12.3% |
| Standard Deviation (Population) | 22.8% | 12.2% |
Similar Demographics by Single Mother Poverty
Demographics Similar to Swiss by Single Mother Poverty
In terms of single mother poverty, the demographic groups most similar to Swiss are Malaysian (29.7%, a difference of 0.020%), Immigrants (29.7%, a difference of 0.050%), Czechoslovakian (29.7%, a difference of 0.10%), Belgian (29.7%, a difference of 0.12%), and Immigrants from Haiti (29.7%, a difference of 0.12%).
| Demographics | Rating | Rank | Single Mother Poverty |
| Spanish American Indians | 23.4 /100 | #196 | Fair 29.6% |
| Immigrants | Jamaica | 22.0 /100 | #197 | Fair 29.6% |
| Trinidadians and Tobagonians | 21.7 /100 | #198 | Fair 29.6% |
| Cubans | 20.8 /100 | #199 | Fair 29.6% |
| Panamanians | 20.0 /100 | #200 | Fair 29.6% |
| Belgians | 18.8 /100 | #201 | Poor 29.7% |
| Malaysians | 17.4 /100 | #202 | Poor 29.7% |
| Swiss | 17.2 /100 | #203 | Poor 29.7% |
| Immigrants | Immigrants | 16.6 /100 | #204 | Poor 29.7% |
| Czechoslovakians | 16.1 /100 | #205 | Poor 29.7% |
| Immigrants | Haiti | 15.8 /100 | #206 | Poor 29.7% |
| Immigrants | Panama | 15.5 /100 | #207 | Poor 29.8% |
| Immigrants | Guyana | 14.7 /100 | #208 | Poor 29.8% |
| Irish | 13.9 /100 | #209 | Poor 29.8% |
| Haitians | 13.3 /100 | #210 | Poor 29.8% |
Demographics Similar to Immigrants from Nicaragua by Single Mother Poverty
In terms of single mother poverty, the demographic groups most similar to Immigrants from Nicaragua are Immigrants from Middle Africa (30.3%, a difference of 0.0%), Immigrants from Grenada (30.3%, a difference of 0.030%), Welsh (30.4%, a difference of 0.10%), Immigrants from St. Vincent and the Grenadines (30.4%, a difference of 0.14%), and Alaskan Athabascan (30.3%, a difference of 0.22%).
| Demographics | Rating | Rank | Single Mother Poverty |
| Immigrants | Liberia | 5.9 /100 | #227 | Tragic 30.1% |
| Spaniards | 5.4 /100 | #228 | Tragic 30.2% |
| Immigrants | Barbados | 5.0 /100 | #229 | Tragic 30.2% |
| English | 4.8 /100 | #230 | Tragic 30.2% |
| Dutch | 4.3 /100 | #231 | Tragic 30.2% |
| Alaskan Athabascans | 4.1 /100 | #232 | Tragic 30.3% |
| Immigrants | Middle Africa | 3.5 /100 | #233 | Tragic 30.3% |
| Immigrants | Nicaragua | 3.5 /100 | #234 | Tragic 30.3% |
| Immigrants | Grenada | 3.4 /100 | #235 | Tragic 30.3% |
| Welsh | 3.2 /100 | #236 | Tragic 30.4% |
| Immigrants | St. Vincent and the Grenadines | 3.1 /100 | #237 | Tragic 30.4% |
| Slovaks | 2.8 /100 | #238 | Tragic 30.4% |
| Immigrants | Portugal | 2.1 /100 | #239 | Tragic 30.5% |
| Salvadorans | 1.8 /100 | #240 | Tragic 30.6% |
| Immigrants | Laos | 1.8 /100 | #241 | Tragic 30.6% |