Swiss vs Immigrants from Africa Seniors Poverty Over the Age of 75
COMPARE
Swiss
Immigrants from Africa
Seniors Poverty Over the Age of 75
Seniors Poverty Over the Age of 75 Comparison
Swiss
Immigrants from Africa
10.7%
SENIORS POVERTY OVER THE AGE OF 75
99.7/ 100
METRIC RATING
30th/ 347
METRIC RANK
12.9%
SENIORS POVERTY OVER THE AGE OF 75
5.9/ 100
METRIC RATING
214th/ 347
METRIC RANK
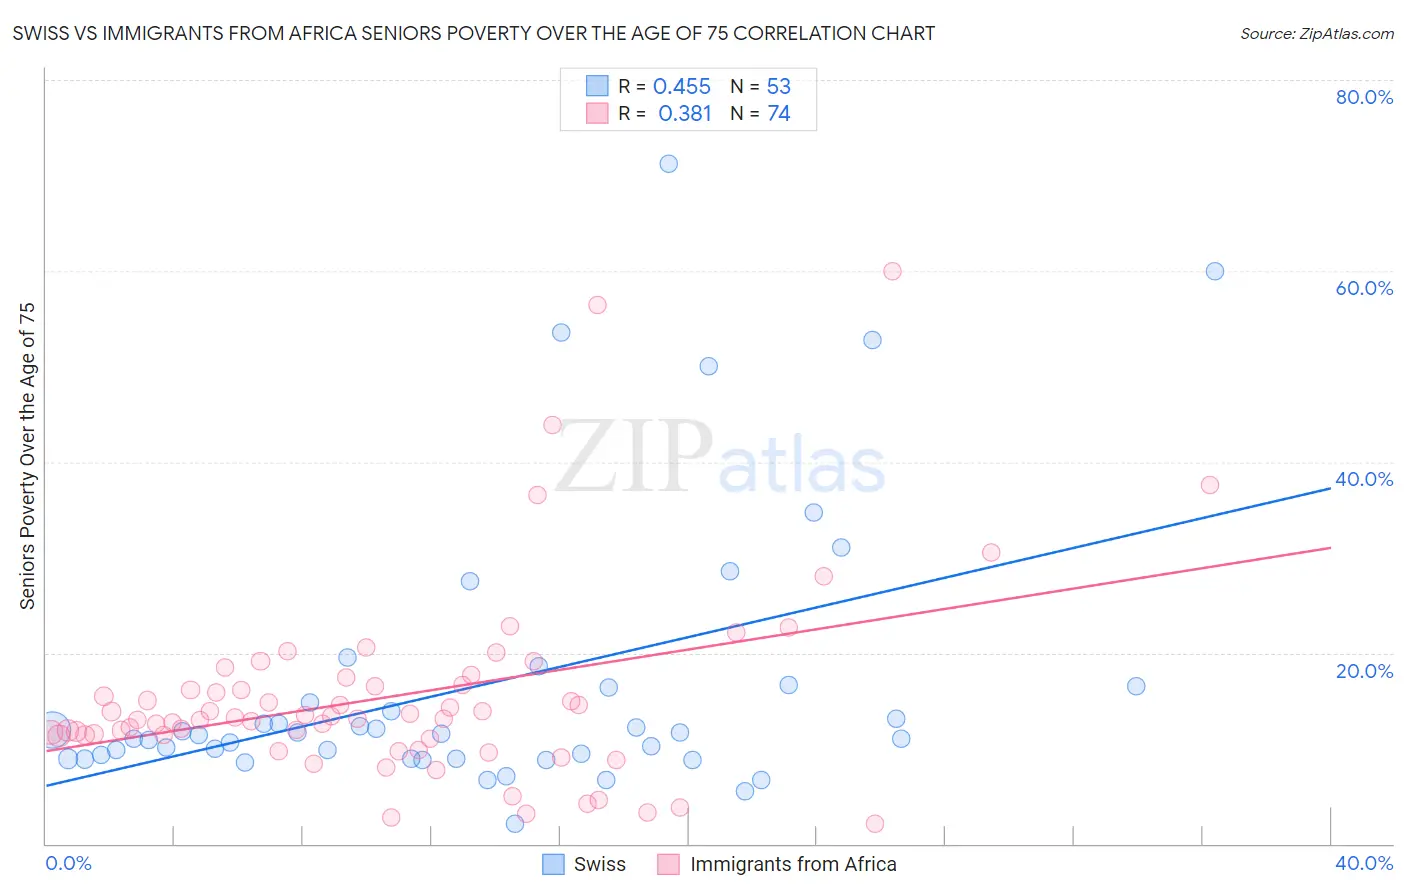
Swiss vs Immigrants from Africa Seniors Poverty Over the Age of 75 Correlation Chart
The statistical analysis conducted on geographies consisting of 456,866,168 people shows a moderate positive correlation between the proportion of Swiss and poverty level among seniors over the age of 75 in the United States with a correlation coefficient (R) of 0.455 and weighted average of 10.7%. Similarly, the statistical analysis conducted on geographies consisting of 462,068,904 people shows a mild positive correlation between the proportion of Immigrants from Africa and poverty level among seniors over the age of 75 in the United States with a correlation coefficient (R) of 0.381 and weighted average of 12.9%, a difference of 20.2%.
Seniors Poverty Over the Age of 75 Correlation Summary
| Measurement | Swiss | Immigrants from Africa |
| Minimum | 2.1% | 2.1% |
| Maximum | 71.2% | 60.0% |
| Range | 69.1% | 57.9% |
| Mean | 16.7% | 15.5% |
| Median | 11.5% | 13.2% |
| Interquartile 25% (IQ1) | 8.9% | 11.3% |
| Interquartile 75% (IQ3) | 16.4% | 16.7% |
| Interquartile Range (IQR) | 7.5% | 5.4% |
| Standard Deviation (Sample) | 14.8% | 10.4% |
| Standard Deviation (Population) | 14.7% | 10.3% |
Similar Demographics by Seniors Poverty Over the Age of 75
Demographics Similar to Swiss by Seniors Poverty Over the Age of 75
In terms of seniors poverty over the age of 75, the demographic groups most similar to Swiss are Assyrian/Chaldean/Syriac (10.7%, a difference of 0.080%), Marshallese (10.7%, a difference of 0.19%), Irish (10.7%, a difference of 0.23%), Northern European (10.7%, a difference of 0.29%), and British (10.7%, a difference of 0.32%).
| Demographics | Rating | Rank | Seniors Poverty Over the Age of 75 |
| Lithuanians | 99.8 /100 | #23 | Exceptional 10.6% |
| Poles | 99.8 /100 | #24 | Exceptional 10.6% |
| Menominee | 99.8 /100 | #25 | Exceptional 10.6% |
| Bulgarians | 99.8 /100 | #26 | Exceptional 10.7% |
| Northern Europeans | 99.8 /100 | #27 | Exceptional 10.7% |
| Irish | 99.8 /100 | #28 | Exceptional 10.7% |
| Assyrians/Chaldeans/Syriacs | 99.8 /100 | #29 | Exceptional 10.7% |
| Swiss | 99.7 /100 | #30 | Exceptional 10.7% |
| Marshallese | 99.7 /100 | #31 | Exceptional 10.7% |
| British | 99.7 /100 | #32 | Exceptional 10.7% |
| Puget Sound Salish | 99.7 /100 | #33 | Exceptional 10.8% |
| Italians | 99.7 /100 | #34 | Exceptional 10.8% |
| Luxembourgers | 99.6 /100 | #35 | Exceptional 10.8% |
| Scotch-Irish | 99.6 /100 | #36 | Exceptional 10.8% |
| Latvians | 99.6 /100 | #37 | Exceptional 10.8% |
Demographics Similar to Immigrants from Africa by Seniors Poverty Over the Age of 75
In terms of seniors poverty over the age of 75, the demographic groups most similar to Immigrants from Africa are French American Indian (12.9%, a difference of 0.070%), South American Indian (12.9%, a difference of 0.14%), Immigrants from Hong Kong (12.8%, a difference of 0.22%), Immigrants from Brazil (12.9%, a difference of 0.26%), and Brazilian (12.8%, a difference of 0.35%).
| Demographics | Rating | Rank | Seniors Poverty Over the Age of 75 |
| Costa Ricans | 8.7 /100 | #207 | Tragic 12.8% |
| Immigrants | Eastern Asia | 8.4 /100 | #208 | Tragic 12.8% |
| Immigrants | Liberia | 7.3 /100 | #209 | Tragic 12.8% |
| Comanche | 7.0 /100 | #210 | Tragic 12.8% |
| Brazilians | 6.9 /100 | #211 | Tragic 12.8% |
| Immigrants | Hong Kong | 6.5 /100 | #212 | Tragic 12.8% |
| French American Indians | 6.1 /100 | #213 | Tragic 12.9% |
| Immigrants | Africa | 5.9 /100 | #214 | Tragic 12.9% |
| South American Indians | 5.5 /100 | #215 | Tragic 12.9% |
| Immigrants | Brazil | 5.2 /100 | #216 | Tragic 12.9% |
| Bermudans | 4.9 /100 | #217 | Tragic 12.9% |
| Immigrants | Western Asia | 4.9 /100 | #218 | Tragic 12.9% |
| Ute | 4.7 /100 | #219 | Tragic 12.9% |
| Seminole | 4.5 /100 | #220 | Tragic 12.9% |
| Immigrants | Kazakhstan | 4.3 /100 | #221 | Tragic 13.0% |