Swedish vs Creek Child Poverty Among Boys Under 16
COMPARE
Swedish
Creek
Child Poverty Among Boys Under 16
Child Poverty Among Boys Under 16 Comparison
Swedes
Creek
13.6%
CHILD POVERTY AMONG BOYS UNDER 16
99.8/ 100
METRIC RATING
30th/ 347
METRIC RANK
21.5%
CHILD POVERTY AMONG BOYS UNDER 16
0.0/ 100
METRIC RATING
310th/ 347
METRIC RANK
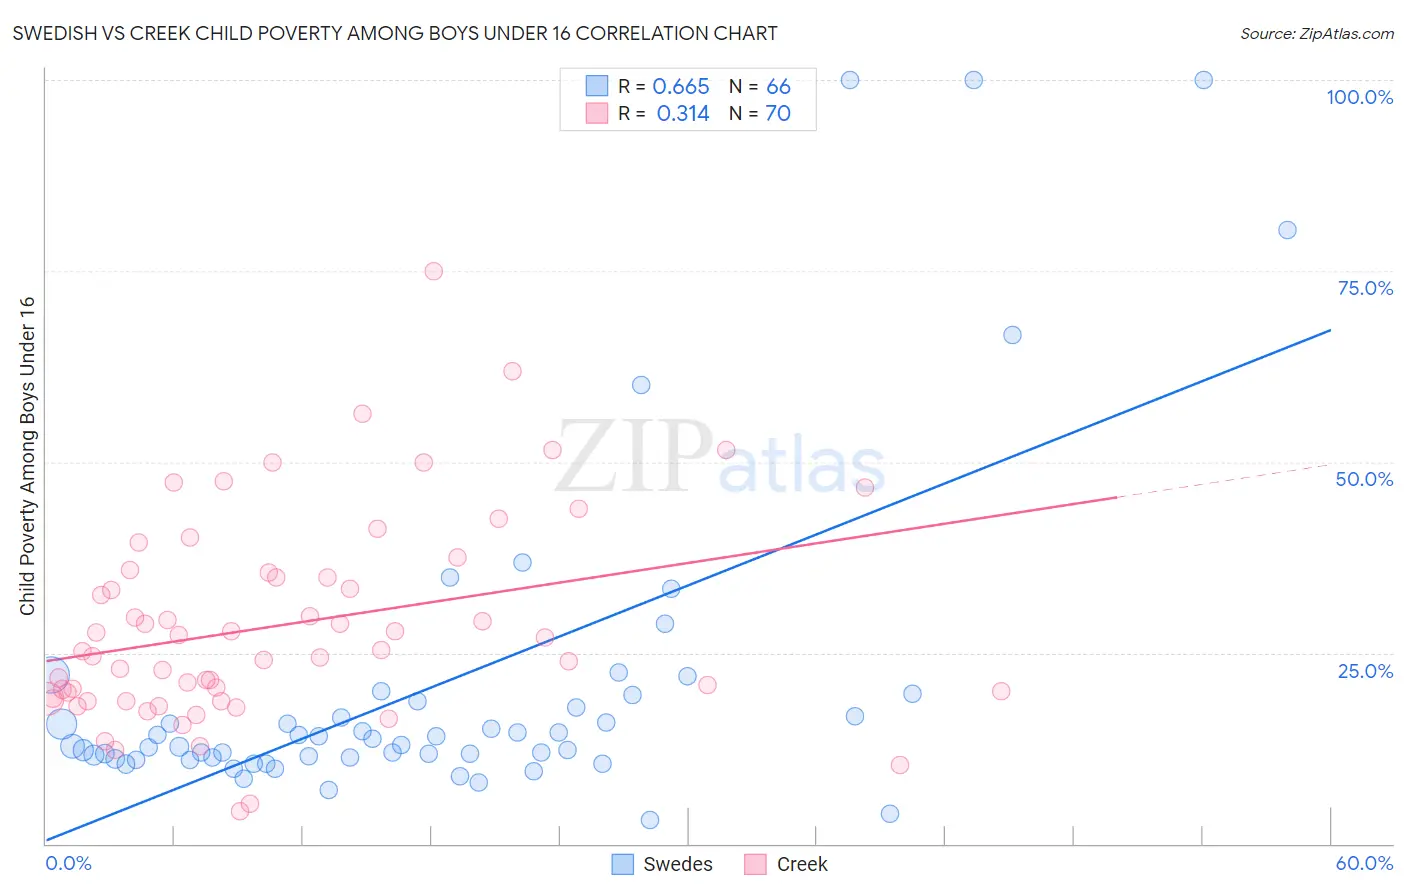
Swedish vs Creek Child Poverty Among Boys Under 16 Correlation Chart
The statistical analysis conducted on geographies consisting of 521,105,782 people shows a significant positive correlation between the proportion of Swedes and poverty level among boys under the age of 16 in the United States with a correlation coefficient (R) of 0.665 and weighted average of 13.6%. Similarly, the statistical analysis conducted on geographies consisting of 177,656,713 people shows a mild positive correlation between the proportion of Creek and poverty level among boys under the age of 16 in the United States with a correlation coefficient (R) of 0.314 and weighted average of 21.5%, a difference of 58.7%.
Child Poverty Among Boys Under 16 Correlation Summary
| Measurement | Swedish | Creek |
| Minimum | 3.0% | 4.2% |
| Maximum | 100.0% | 75.0% |
| Range | 97.0% | 70.8% |
| Mean | 20.9% | 28.7% |
| Median | 13.3% | 25.2% |
| Interquartile 25% (IQ1) | 11.3% | 19.0% |
| Interquartile 75% (IQ3) | 18.6% | 35.5% |
| Interquartile Range (IQR) | 7.3% | 16.5% |
| Standard Deviation (Sample) | 21.8% | 13.5% |
| Standard Deviation (Population) | 21.6% | 13.4% |
Similar Demographics by Child Poverty Among Boys Under 16
Demographics Similar to Swedes by Child Poverty Among Boys Under 16
In terms of child poverty among boys under 16, the demographic groups most similar to Swedes are Turkish (13.6%, a difference of 0.080%), Cypriot (13.6%, a difference of 0.090%), Immigrants from China (13.6%, a difference of 0.17%), Eastern European (13.5%, a difference of 0.28%), and Asian (13.5%, a difference of 0.35%).
| Demographics | Rating | Rank | Child Poverty Among Boys Under 16 |
| Latvians | 99.9 /100 | #23 | Exceptional 13.4% |
| Immigrants | Lithuania | 99.8 /100 | #24 | Exceptional 13.5% |
| Okinawans | 99.8 /100 | #25 | Exceptional 13.5% |
| Immigrants | Bolivia | 99.8 /100 | #26 | Exceptional 13.5% |
| Asians | 99.8 /100 | #27 | Exceptional 13.5% |
| Eastern Europeans | 99.8 /100 | #28 | Exceptional 13.5% |
| Cypriots | 99.8 /100 | #29 | Exceptional 13.6% |
| Swedes | 99.8 /100 | #30 | Exceptional 13.6% |
| Turks | 99.8 /100 | #31 | Exceptional 13.6% |
| Immigrants | China | 99.8 /100 | #32 | Exceptional 13.6% |
| Danes | 99.8 /100 | #33 | Exceptional 13.6% |
| Assyrians/Chaldeans/Syriacs | 99.8 /100 | #34 | Exceptional 13.6% |
| Russians | 99.7 /100 | #35 | Exceptional 13.8% |
| Luxembourgers | 99.7 /100 | #36 | Exceptional 13.8% |
| Immigrants | Sri Lanka | 99.6 /100 | #37 | Exceptional 13.9% |
Demographics Similar to Creek by Child Poverty Among Boys Under 16
In terms of child poverty among boys under 16, the demographic groups most similar to Creek are Seminole (21.5%, a difference of 0.060%), Bahamian (21.6%, a difference of 0.11%), Immigrants from Guatemala (21.6%, a difference of 0.19%), British West Indian (21.6%, a difference of 0.20%), and Ute (21.6%, a difference of 0.21%).
| Demographics | Rating | Rank | Child Poverty Among Boys Under 16 |
| Immigrants | Haiti | 0.0 /100 | #303 | Tragic 21.3% |
| Immigrants | Central America | 0.0 /100 | #304 | Tragic 21.3% |
| Kiowa | 0.0 /100 | #305 | Tragic 21.3% |
| Immigrants | Grenada | 0.0 /100 | #306 | Tragic 21.3% |
| Choctaw | 0.0 /100 | #307 | Tragic 21.3% |
| Immigrants | Mexico | 0.0 /100 | #308 | Tragic 21.5% |
| Seminole | 0.0 /100 | #309 | Tragic 21.5% |
| Creek | 0.0 /100 | #310 | Tragic 21.5% |
| Bahamians | 0.0 /100 | #311 | Tragic 21.6% |
| Immigrants | Guatemala | 0.0 /100 | #312 | Tragic 21.6% |
| British West Indians | 0.0 /100 | #313 | Tragic 21.6% |
| Ute | 0.0 /100 | #314 | Tragic 21.6% |
| Immigrants | Somalia | 0.0 /100 | #315 | Tragic 21.7% |
| Menominee | 0.0 /100 | #316 | Tragic 21.7% |
| Africans | 0.0 /100 | #317 | Tragic 21.7% |