Sudanese vs Immigrants from Ireland Family Poverty
COMPARE
Sudanese
Immigrants from Ireland
Family Poverty
Family Poverty Comparison
Sudanese
Immigrants from Ireland
10.0%
FAMILY POVERTY
3.1/ 100
METRIC RATING
228th/ 347
METRIC RANK
7.0%
FAMILY POVERTY
99.9/ 100
METRIC RATING
7th/ 347
METRIC RANK
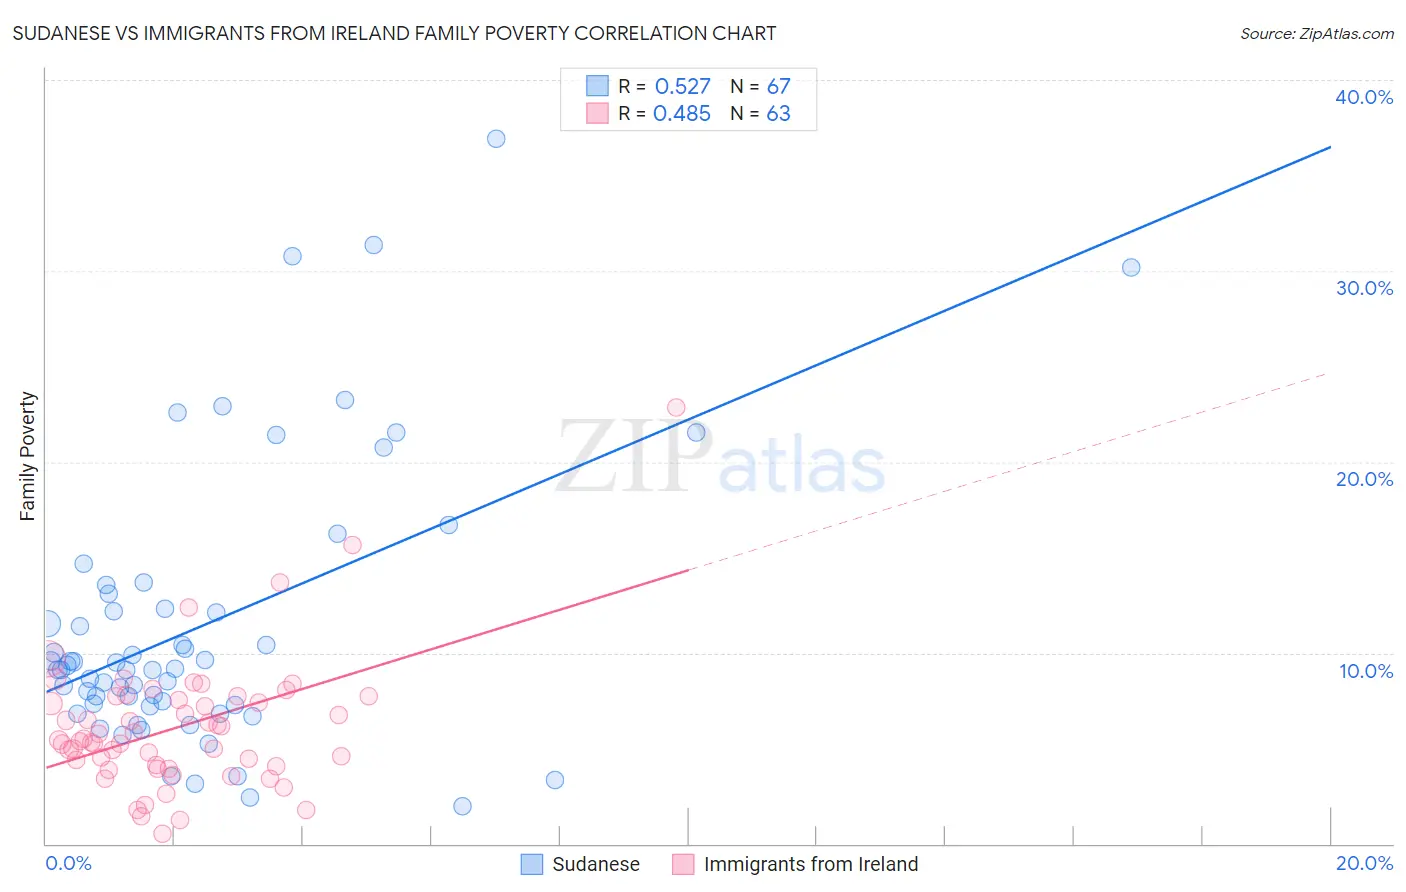
Sudanese vs Immigrants from Ireland Family Poverty Correlation Chart
The statistical analysis conducted on geographies consisting of 110,085,531 people shows a substantial positive correlation between the proportion of Sudanese and poverty level among families in the United States with a correlation coefficient (R) of 0.527 and weighted average of 10.0%. Similarly, the statistical analysis conducted on geographies consisting of 240,395,025 people shows a moderate positive correlation between the proportion of Immigrants from Ireland and poverty level among families in the United States with a correlation coefficient (R) of 0.485 and weighted average of 7.0%, a difference of 43.5%.
Family Poverty Correlation Summary
| Measurement | Sudanese | Immigrants from Ireland |
| Minimum | 1.9% | 0.55% |
| Maximum | 36.9% | 22.9% |
| Range | 35.0% | 22.3% |
| Mean | 11.5% | 6.1% |
| Median | 9.2% | 5.4% |
| Interquartile 25% (IQ1) | 7.3% | 4.0% |
| Interquartile 75% (IQ3) | 13.1% | 7.7% |
| Interquartile Range (IQR) | 5.8% | 3.7% |
| Standard Deviation (Sample) | 7.3% | 3.5% |
| Standard Deviation (Population) | 7.3% | 3.5% |
Similar Demographics by Family Poverty
Demographics Similar to Sudanese by Family Poverty
In terms of family poverty, the demographic groups most similar to Sudanese are Immigrants from Uzbekistan (10.0%, a difference of 0.010%), Immigrants from Panama (10.0%, a difference of 0.030%), Immigrants from Armenia (10.0%, a difference of 0.20%), Ottawa (10.0%, a difference of 0.22%), and Alaskan Athabascan (10.1%, a difference of 0.41%).
| Demographics | Rating | Rank | Family Poverty |
| Immigrants | Cambodia | 4.8 /100 | #221 | Tragic 9.9% |
| Japanese | 4.8 /100 | #222 | Tragic 9.9% |
| Immigrants | Africa | 4.3 /100 | #223 | Tragic 9.9% |
| Marshallese | 3.9 /100 | #224 | Tragic 9.9% |
| Immigrants | Immigrants | 3.6 /100 | #225 | Tragic 10.0% |
| Ottawa | 3.3 /100 | #226 | Tragic 10.0% |
| Immigrants | Armenia | 3.3 /100 | #227 | Tragic 10.0% |
| Sudanese | 3.1 /100 | #228 | Tragic 10.0% |
| Immigrants | Uzbekistan | 3.1 /100 | #229 | Tragic 10.0% |
| Immigrants | Panama | 3.1 /100 | #230 | Tragic 10.0% |
| Alaskan Athabascans | 2.7 /100 | #231 | Tragic 10.1% |
| Immigrants | Sudan | 2.3 /100 | #232 | Tragic 10.1% |
| Fijians | 2.1 /100 | #233 | Tragic 10.1% |
| Immigrants | Middle Africa | 2.1 /100 | #234 | Tragic 10.1% |
| Nigerians | 2.0 /100 | #235 | Tragic 10.1% |
Demographics Similar to Immigrants from Ireland by Family Poverty
In terms of family poverty, the demographic groups most similar to Immigrants from Ireland are Bhutanese (7.0%, a difference of 0.91%), Latvian (7.1%, a difference of 1.3%), Norwegian (6.9%, a difference of 1.4%), Bulgarian (7.1%, a difference of 1.6%), and Immigrants from Singapore (7.1%, a difference of 1.6%).
| Demographics | Rating | Rank | Family Poverty |
| Immigrants | India | 100.0 /100 | #1 | Exceptional 6.2% |
| Chinese | 100.0 /100 | #2 | Exceptional 6.5% |
| Immigrants | Taiwan | 100.0 /100 | #3 | Exceptional 6.6% |
| Filipinos | 100.0 /100 | #4 | Exceptional 6.6% |
| Thais | 100.0 /100 | #5 | Exceptional 6.7% |
| Norwegians | 99.9 /100 | #6 | Exceptional 6.9% |
| Immigrants | Ireland | 99.9 /100 | #7 | Exceptional 7.0% |
| Bhutanese | 99.9 /100 | #8 | Exceptional 7.0% |
| Latvians | 99.9 /100 | #9 | Exceptional 7.1% |
| Bulgarians | 99.8 /100 | #10 | Exceptional 7.1% |
| Immigrants | Singapore | 99.8 /100 | #11 | Exceptional 7.1% |
| Maltese | 99.8 /100 | #12 | Exceptional 7.1% |
| Swedes | 99.8 /100 | #13 | Exceptional 7.1% |
| Iranians | 99.8 /100 | #14 | Exceptional 7.1% |
| Lithuanians | 99.8 /100 | #15 | Exceptional 7.2% |