Sudanese vs Egyptian Single Father Poverty
COMPARE
Sudanese
Egyptian
Single Father Poverty
Single Father Poverty Comparison
Sudanese
Egyptians
15.9%
SINGLE FATHER POVERTY
91.6/ 100
METRIC RATING
122nd/ 347
METRIC RANK
14.7%
SINGLE FATHER POVERTY
100.0/ 100
METRIC RATING
34th/ 347
METRIC RANK
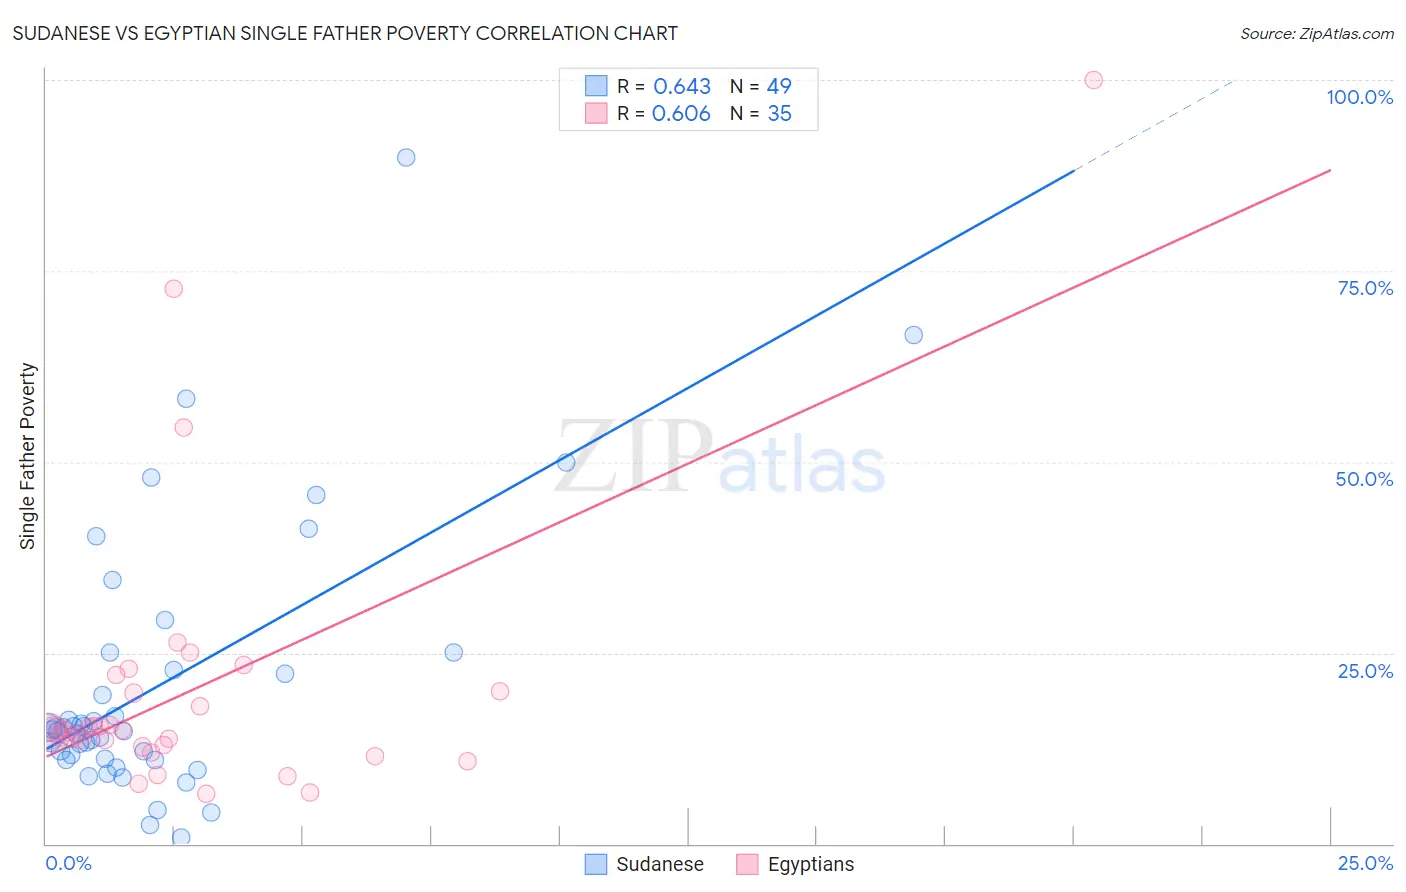
Sudanese vs Egyptian Single Father Poverty Correlation Chart
The statistical analysis conducted on geographies consisting of 100,935,814 people shows a significant positive correlation between the proportion of Sudanese and poverty level among single fathers in the United States with a correlation coefficient (R) of 0.643 and weighted average of 15.9%. Similarly, the statistical analysis conducted on geographies consisting of 226,846,927 people shows a significant positive correlation between the proportion of Egyptians and poverty level among single fathers in the United States with a correlation coefficient (R) of 0.606 and weighted average of 14.7%, a difference of 8.3%.
Single Father Poverty Correlation Summary
| Measurement | Sudanese | Egyptian |
| Minimum | 0.76% | 6.6% |
| Maximum | 89.9% | 100.0% |
| Range | 89.1% | 93.4% |
| Mean | 20.8% | 20.2% |
| Median | 14.9% | 14.8% |
| Interquartile 25% (IQ1) | 11.0% | 12.7% |
| Interquartile 75% (IQ3) | 23.9% | 20.0% |
| Interquartile Range (IQR) | 12.9% | 7.3% |
| Standard Deviation (Sample) | 17.6% | 18.7% |
| Standard Deviation (Population) | 17.4% | 18.5% |
Similar Demographics by Single Father Poverty
Demographics Similar to Sudanese by Single Father Poverty
In terms of single father poverty, the demographic groups most similar to Sudanese are Palestinian (15.9%, a difference of 0.040%), Immigrants from Panama (15.9%, a difference of 0.040%), Iraqi (15.9%, a difference of 0.050%), Immigrants (15.9%, a difference of 0.060%), and Hmong (15.9%, a difference of 0.070%).
| Demographics | Rating | Rank | Single Father Poverty |
| Immigrants | Thailand | 93.6 /100 | #115 | Exceptional 15.8% |
| Immigrants | Argentina | 92.8 /100 | #116 | Exceptional 15.8% |
| Immigrants | Colombia | 92.6 /100 | #117 | Exceptional 15.8% |
| Immigrants | Eastern Europe | 92.5 /100 | #118 | Exceptional 15.8% |
| Immigrants | Belarus | 92.4 /100 | #119 | Exceptional 15.8% |
| Uruguayans | 92.1 /100 | #120 | Exceptional 15.9% |
| Immigrants | Immigrants | 91.9 /100 | #121 | Exceptional 15.9% |
| Sudanese | 91.6 /100 | #122 | Exceptional 15.9% |
| Palestinians | 91.3 /100 | #123 | Exceptional 15.9% |
| Immigrants | Panama | 91.3 /100 | #124 | Exceptional 15.9% |
| Iraqis | 91.2 /100 | #125 | Exceptional 15.9% |
| Hmong | 91.1 /100 | #126 | Exceptional 15.9% |
| Immigrants | Liberia | 91.1 /100 | #127 | Exceptional 15.9% |
| Immigrants | Nigeria | 90.8 /100 | #128 | Exceptional 15.9% |
| Immigrants | West Indies | 90.8 /100 | #129 | Exceptional 15.9% |
Demographics Similar to Egyptians by Single Father Poverty
In terms of single father poverty, the demographic groups most similar to Egyptians are Immigrants from Bolivia (14.7%, a difference of 0.070%), Okinawan (14.6%, a difference of 0.10%), Immigrants from Indonesia (14.7%, a difference of 0.24%), Immigrants from Eastern Africa (14.7%, a difference of 0.36%), and Bolivian (14.7%, a difference of 0.37%).
| Demographics | Rating | Rank | Single Father Poverty |
| Nepalese | 100.0 /100 | #27 | Exceptional 14.4% |
| Immigrants | South Central Asia | 100.0 /100 | #28 | Exceptional 14.5% |
| Somalis | 100.0 /100 | #29 | Exceptional 14.5% |
| Thais | 100.0 /100 | #30 | Exceptional 14.5% |
| Icelanders | 100.0 /100 | #31 | Exceptional 14.5% |
| Asians | 100.0 /100 | #32 | Exceptional 14.6% |
| Okinawans | 100.0 /100 | #33 | Exceptional 14.6% |
| Egyptians | 100.0 /100 | #34 | Exceptional 14.7% |
| Immigrants | Bolivia | 100.0 /100 | #35 | Exceptional 14.7% |
| Immigrants | Indonesia | 100.0 /100 | #36 | Exceptional 14.7% |
| Immigrants | Eastern Africa | 100.0 /100 | #37 | Exceptional 14.7% |
| Bolivians | 100.0 /100 | #38 | Exceptional 14.7% |
| Immigrants | Asia | 100.0 /100 | #39 | Exceptional 14.7% |
| Pima | 100.0 /100 | #40 | Exceptional 14.8% |
| Indians (Asian) | 100.0 /100 | #41 | Exceptional 14.8% |