Sudanese vs Argentinean Male Poverty
COMPARE
Sudanese
Argentinean
Male Poverty
Male Poverty Comparison
Sudanese
Argentineans
12.8%
MALE POVERTY
0.3/ 100
METRIC RATING
241st/ 347
METRIC RANK
10.6%
MALE POVERTY
90.1/ 100
METRIC RATING
110th/ 347
METRIC RANK
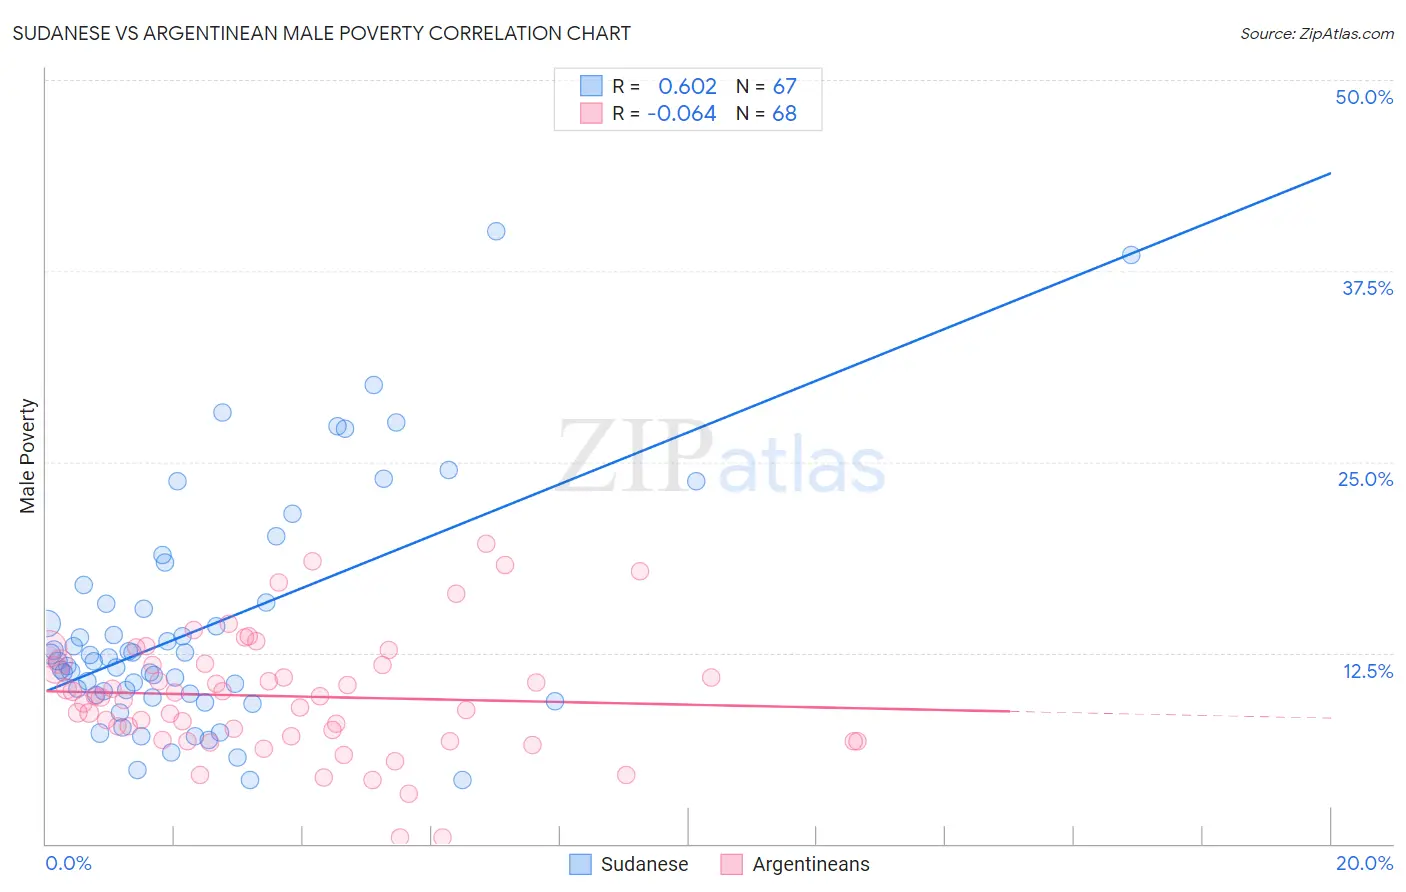
Sudanese vs Argentinean Male Poverty Correlation Chart
The statistical analysis conducted on geographies consisting of 110,106,340 people shows a significant positive correlation between the proportion of Sudanese and poverty level among males in the United States with a correlation coefficient (R) of 0.602 and weighted average of 12.8%. Similarly, the statistical analysis conducted on geographies consisting of 296,917,250 people shows a slight negative correlation between the proportion of Argentineans and poverty level among males in the United States with a correlation coefficient (R) of -0.064 and weighted average of 10.6%, a difference of 20.6%.
Male Poverty Correlation Summary
| Measurement | Sudanese | Argentinean |
| Minimum | 4.2% | 0.38% |
| Maximum | 40.1% | 19.6% |
| Range | 35.9% | 19.3% |
| Mean | 14.2% | 9.7% |
| Median | 12.0% | 9.6% |
| Interquartile 25% (IQ1) | 9.8% | 6.9% |
| Interquartile 75% (IQ3) | 15.8% | 11.7% |
| Interquartile Range (IQR) | 6.1% | 4.8% |
| Standard Deviation (Sample) | 7.6% | 3.9% |
| Standard Deviation (Population) | 7.6% | 3.9% |
Similar Demographics by Male Poverty
Demographics Similar to Sudanese by Male Poverty
In terms of male poverty, the demographic groups most similar to Sudanese are Nepalese (12.8%, a difference of 0.17%), Alaskan Athabascan (12.8%, a difference of 0.20%), Tsimshian (12.8%, a difference of 0.31%), Liberian (12.8%, a difference of 0.32%), and Immigrants from Middle Africa (12.7%, a difference of 0.36%).
| Demographics | Rating | Rank | Male Poverty |
| Immigrants | Armenia | 0.6 /100 | #234 | Tragic 12.6% |
| Immigrants | Laos | 0.5 /100 | #235 | Tragic 12.6% |
| Immigrants | Saudi Arabia | 0.4 /100 | #236 | Tragic 12.7% |
| French American Indians | 0.4 /100 | #237 | Tragic 12.7% |
| Ecuadorians | 0.4 /100 | #238 | Tragic 12.7% |
| Ghanaians | 0.4 /100 | #239 | Tragic 12.7% |
| Immigrants | Middle Africa | 0.4 /100 | #240 | Tragic 12.7% |
| Sudanese | 0.3 /100 | #241 | Tragic 12.8% |
| Nepalese | 0.3 /100 | #242 | Tragic 12.8% |
| Alaskan Athabascans | 0.3 /100 | #243 | Tragic 12.8% |
| Tsimshian | 0.3 /100 | #244 | Tragic 12.8% |
| Liberians | 0.3 /100 | #245 | Tragic 12.8% |
| Immigrants | El Salvador | 0.2 /100 | #246 | Tragic 12.8% |
| Immigrants | Western Africa | 0.2 /100 | #247 | Tragic 12.9% |
| Immigrants | Sudan | 0.2 /100 | #248 | Tragic 12.9% |
Demographics Similar to Argentineans by Male Poverty
In terms of male poverty, the demographic groups most similar to Argentineans are Immigrants from Argentina (10.6%, a difference of 0.11%), Albanian (10.6%, a difference of 0.13%), Immigrants from Turkey (10.6%, a difference of 0.19%), Portuguese (10.6%, a difference of 0.26%), and Palestinian (10.6%, a difference of 0.29%).
| Demographics | Rating | Rank | Male Poverty |
| Slavs | 91.7 /100 | #103 | Exceptional 10.5% |
| Welsh | 91.6 /100 | #104 | Exceptional 10.5% |
| Canadians | 91.6 /100 | #105 | Exceptional 10.5% |
| Immigrants | Southern Europe | 91.3 /100 | #106 | Exceptional 10.5% |
| Laotians | 91.2 /100 | #107 | Exceptional 10.5% |
| Portuguese | 91.0 /100 | #108 | Exceptional 10.6% |
| Albanians | 90.6 /100 | #109 | Exceptional 10.6% |
| Argentineans | 90.1 /100 | #110 | Exceptional 10.6% |
| Immigrants | Argentina | 89.8 /100 | #111 | Excellent 10.6% |
| Immigrants | Turkey | 89.5 /100 | #112 | Excellent 10.6% |
| Palestinians | 89.1 /100 | #113 | Excellent 10.6% |
| Immigrants | Brazil | 89.0 /100 | #114 | Excellent 10.6% |
| Immigrants | Russia | 88.6 /100 | #115 | Excellent 10.6% |
| Sri Lankans | 88.1 /100 | #116 | Excellent 10.6% |
| Immigrants | South Eastern Asia | 88.1 /100 | #117 | Excellent 10.6% |