Subsaharan African vs Immigrants from Caribbean Single Male Poverty
COMPARE
Subsaharan African
Immigrants from Caribbean
Single Male Poverty
Single Male Poverty Comparison
Sub-Saharan Africans
Immigrants from Caribbean
13.7%
SINGLE MALE POVERTY
0.5/ 100
METRIC RATING
254th/ 347
METRIC RANK
13.3%
SINGLE MALE POVERTY
5.0/ 100
METRIC RATING
232nd/ 347
METRIC RANK
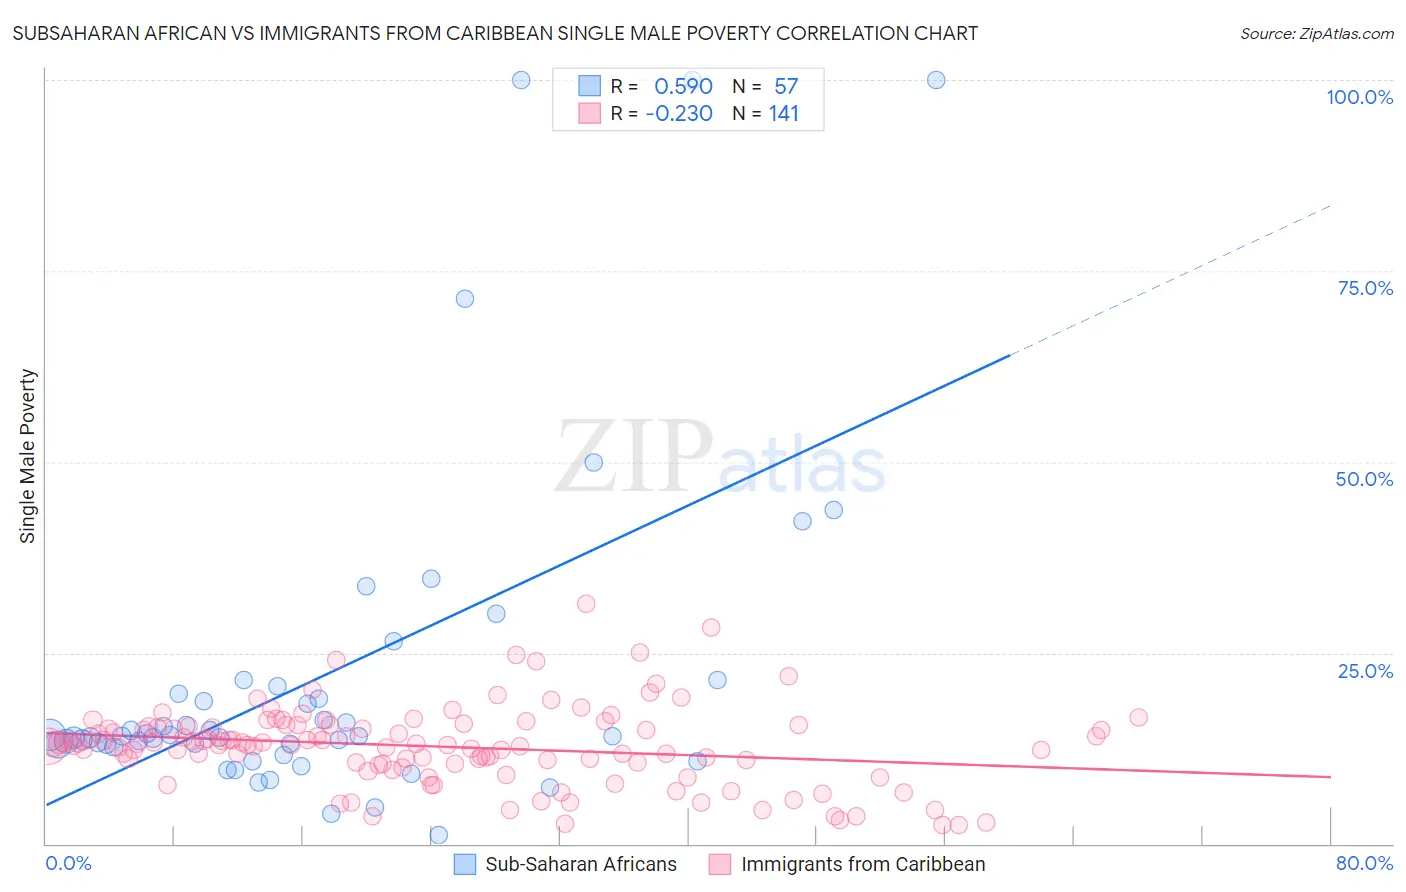
Subsaharan African vs Immigrants from Caribbean Single Male Poverty Correlation Chart
The statistical analysis conducted on geographies consisting of 440,120,617 people shows a substantial positive correlation between the proportion of Sub-Saharan Africans and poverty level among single males in the United States with a correlation coefficient (R) of 0.590 and weighted average of 13.7%. Similarly, the statistical analysis conducted on geographies consisting of 393,892,998 people shows a weak negative correlation between the proportion of Immigrants from Caribbean and poverty level among single males in the United States with a correlation coefficient (R) of -0.230 and weighted average of 13.3%, a difference of 3.0%.
Single Male Poverty Correlation Summary
| Measurement | Subsaharan African | Immigrants from Caribbean |
| Minimum | 1.1% | 2.4% |
| Maximum | 100.0% | 31.5% |
| Range | 98.9% | 29.0% |
| Mean | 21.8% | 12.8% |
| Median | 14.1% | 13.0% |
| Interquartile 25% (IQ1) | 12.8% | 10.5% |
| Interquartile 75% (IQ3) | 20.1% | 15.4% |
| Interquartile Range (IQR) | 7.3% | 4.9% |
| Standard Deviation (Sample) | 22.0% | 5.1% |
| Standard Deviation (Population) | 21.8% | 5.1% |
Similar Demographics by Single Male Poverty
Demographics Similar to Sub-Saharan Africans by Single Male Poverty
In terms of single male poverty, the demographic groups most similar to Sub-Saharan Africans are Spaniard (13.7%, a difference of 0.11%), Immigrants from Belize (13.7%, a difference of 0.21%), Immigrants from Central America (13.8%, a difference of 0.40%), Immigrants from Guatemala (13.8%, a difference of 0.47%), and Guatemalan (13.8%, a difference of 0.51%).
| Demographics | Rating | Rank | Single Male Poverty |
| Belgians | 1.2 /100 | #247 | Tragic 13.5% |
| Czechs | 1.2 /100 | #248 | Tragic 13.5% |
| Spanish | 1.0 /100 | #249 | Tragic 13.6% |
| Immigrants | Somalia | 1.0 /100 | #250 | Tragic 13.6% |
| Immigrants | Zaire | 0.9 /100 | #251 | Tragic 13.6% |
| Finns | 0.9 /100 | #252 | Tragic 13.6% |
| German Russians | 0.8 /100 | #253 | Tragic 13.6% |
| Sub-Saharan Africans | 0.5 /100 | #254 | Tragic 13.7% |
| Spaniards | 0.4 /100 | #255 | Tragic 13.7% |
| Immigrants | Belize | 0.4 /100 | #256 | Tragic 13.7% |
| Immigrants | Central America | 0.3 /100 | #257 | Tragic 13.8% |
| Immigrants | Guatemala | 0.3 /100 | #258 | Tragic 13.8% |
| Guatemalans | 0.3 /100 | #259 | Tragic 13.8% |
| Swiss | 0.3 /100 | #260 | Tragic 13.8% |
| Hungarians | 0.3 /100 | #261 | Tragic 13.8% |
Demographics Similar to Immigrants from Caribbean by Single Male Poverty
In terms of single male poverty, the demographic groups most similar to Immigrants from Caribbean are Slavic (13.3%, a difference of 0.090%), Ghanaian (13.3%, a difference of 0.27%), British (13.3%, a difference of 0.29%), Canadian (13.3%, a difference of 0.29%), and European (13.3%, a difference of 0.30%).
| Demographics | Rating | Rank | Single Male Poverty |
| Immigrants | Denmark | 8.7 /100 | #225 | Tragic 13.2% |
| Jamaicans | 7.7 /100 | #226 | Tragic 13.2% |
| Haitians | 7.0 /100 | #227 | Tragic 13.2% |
| Lebanese | 6.6 /100 | #228 | Tragic 13.2% |
| Europeans | 6.2 /100 | #229 | Tragic 13.3% |
| Ghanaians | 6.1 /100 | #230 | Tragic 13.3% |
| Slavs | 5.3 /100 | #231 | Tragic 13.3% |
| Immigrants | Caribbean | 5.0 /100 | #232 | Tragic 13.3% |
| British | 4.0 /100 | #233 | Tragic 13.3% |
| Canadians | 4.0 /100 | #234 | Tragic 13.3% |
| Bangladeshis | 3.7 /100 | #235 | Tragic 13.3% |
| Luxembourgers | 3.6 /100 | #236 | Tragic 13.4% |
| British West Indians | 3.4 /100 | #237 | Tragic 13.4% |
| Immigrants | Ghana | 3.2 /100 | #238 | Tragic 13.4% |
| Czechoslovakians | 3.0 /100 | #239 | Tragic 13.4% |