Subsaharan African vs Immigrants from Argentina Receiving Food Stamps
COMPARE
Subsaharan African
Immigrants from Argentina
Receiving Food Stamps
Receiving Food Stamps Comparison
Sub-Saharan Africans
Immigrants from Argentina
14.1%
RECEIVING FOOD STAMPS
0.3/ 100
METRIC RATING
255th/ 347
METRIC RANK
11.2%
RECEIVING FOOD STAMPS
80.4/ 100
METRIC RATING
155th/ 347
METRIC RANK
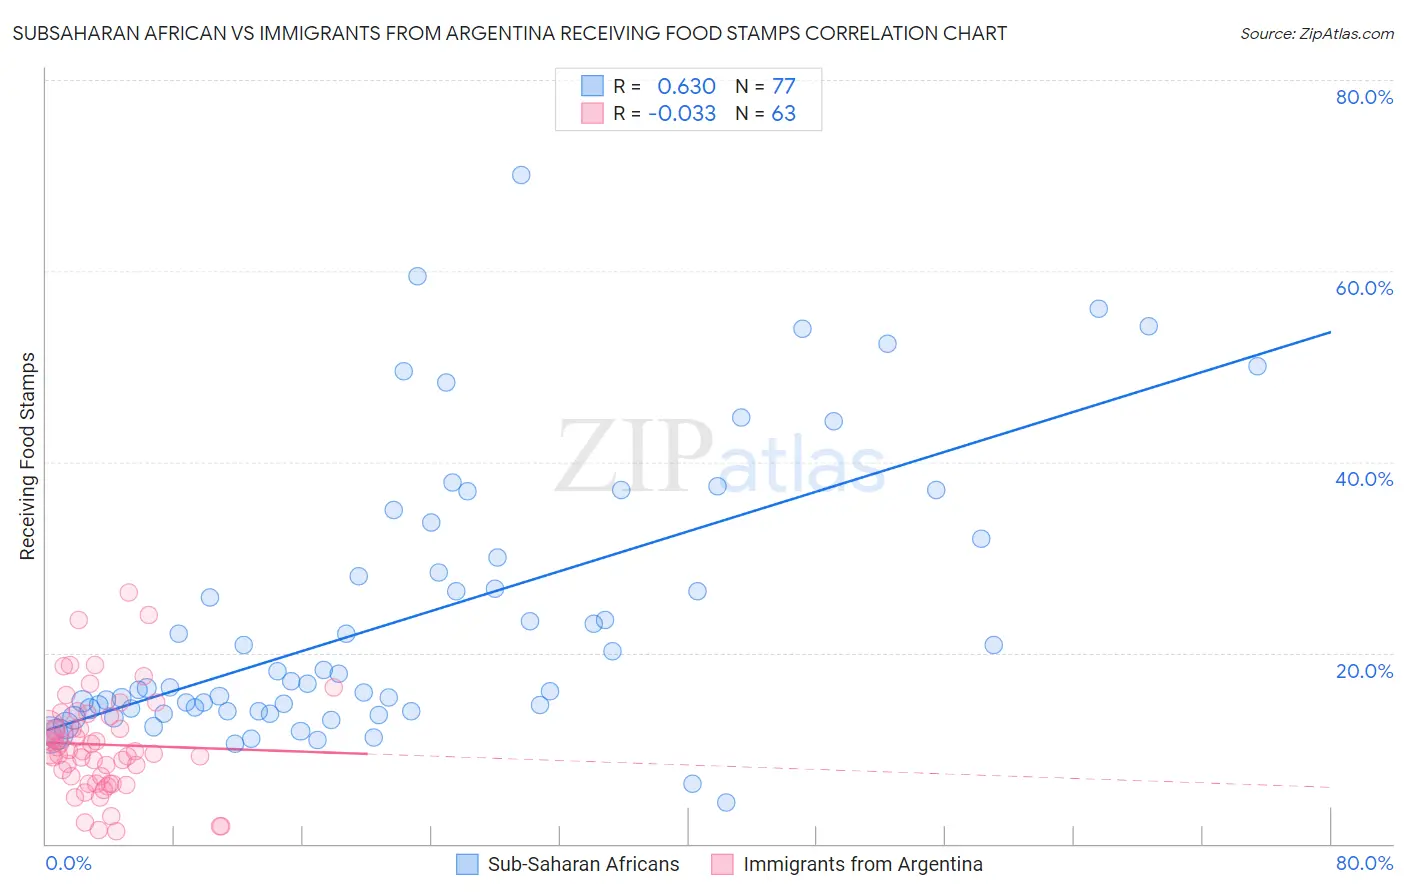
Subsaharan African vs Immigrants from Argentina Receiving Food Stamps Correlation Chart
The statistical analysis conducted on geographies consisting of 506,389,803 people shows a significant positive correlation between the proportion of Sub-Saharan Africans and percentage of population receiving government assistance and/or food stamps in the United States with a correlation coefficient (R) of 0.630 and weighted average of 14.1%. Similarly, the statistical analysis conducted on geographies consisting of 263,859,241 people shows no correlation between the proportion of Immigrants from Argentina and percentage of population receiving government assistance and/or food stamps in the United States with a correlation coefficient (R) of -0.033 and weighted average of 11.2%, a difference of 26.3%.
Receiving Food Stamps Correlation Summary
| Measurement | Subsaharan African | Immigrants from Argentina |
| Minimum | 4.3% | 1.4% |
| Maximum | 70.0% | 26.3% |
| Range | 65.7% | 24.9% |
| Mean | 23.8% | 10.4% |
| Median | 16.8% | 9.6% |
| Interquartile 25% (IQ1) | 13.9% | 6.3% |
| Interquartile 75% (IQ3) | 31.0% | 13.4% |
| Interquartile Range (IQR) | 17.1% | 7.1% |
| Standard Deviation (Sample) | 14.4% | 5.3% |
| Standard Deviation (Population) | 14.3% | 5.3% |
Similar Demographics by Receiving Food Stamps
Demographics Similar to Sub-Saharan Africans by Receiving Food Stamps
In terms of receiving food stamps, the demographic groups most similar to Sub-Saharan Africans are Marshallese (14.1%, a difference of 0.010%), Japanese (14.1%, a difference of 0.020%), Arapaho (14.1%, a difference of 0.12%), Immigrants from Ghana (14.1%, a difference of 0.20%), and Creek (14.1%, a difference of 0.33%).
| Demographics | Rating | Rank | Receiving Food Stamps |
| Immigrants | Laos | 0.7 /100 | #248 | Tragic 13.8% |
| Indonesians | 0.6 /100 | #249 | Tragic 13.9% |
| Immigrants | Cambodia | 0.5 /100 | #250 | Tragic 13.9% |
| Yaqui | 0.5 /100 | #251 | Tragic 13.9% |
| Ghanaians | 0.5 /100 | #252 | Tragic 14.0% |
| Spanish Americans | 0.4 /100 | #253 | Tragic 14.0% |
| Marshallese | 0.3 /100 | #254 | Tragic 14.1% |
| Sub-Saharan Africans | 0.3 /100 | #255 | Tragic 14.1% |
| Japanese | 0.3 /100 | #256 | Tragic 14.1% |
| Arapaho | 0.3 /100 | #257 | Tragic 14.1% |
| Immigrants | Ghana | 0.3 /100 | #258 | Tragic 14.1% |
| Creek | 0.3 /100 | #259 | Tragic 14.1% |
| Central Americans | 0.3 /100 | #260 | Tragic 14.1% |
| Immigrants | Congo | 0.3 /100 | #261 | Tragic 14.1% |
| Paiute | 0.2 /100 | #262 | Tragic 14.3% |
Demographics Similar to Immigrants from Argentina by Receiving Food Stamps
In terms of receiving food stamps, the demographic groups most similar to Immigrants from Argentina are Armenian (11.1%, a difference of 0.25%), Lebanese (11.1%, a difference of 0.31%), Immigrants from Spain (11.1%, a difference of 0.33%), Immigrants from Kazakhstan (11.1%, a difference of 0.33%), and Soviet Union (11.1%, a difference of 0.69%).
| Demographics | Rating | Rank | Receiving Food Stamps |
| Immigrants | South Eastern Asia | 83.3 /100 | #148 | Excellent 11.1% |
| Brazilians | 83.2 /100 | #149 | Excellent 11.1% |
| Soviet Union | 83.1 /100 | #150 | Excellent 11.1% |
| Immigrants | Spain | 81.7 /100 | #151 | Excellent 11.1% |
| Immigrants | Kazakhstan | 81.7 /100 | #152 | Excellent 11.1% |
| Lebanese | 81.6 /100 | #153 | Excellent 11.1% |
| Armenians | 81.4 /100 | #154 | Excellent 11.1% |
| Immigrants | Argentina | 80.4 /100 | #155 | Excellent 11.2% |
| Immigrants | Afghanistan | 75.6 /100 | #156 | Good 11.3% |
| Immigrants | Lebanon | 75.2 /100 | #157 | Good 11.3% |
| Immigrants | Bosnia and Herzegovina | 72.6 /100 | #158 | Good 11.3% |
| Immigrants | Oceania | 70.4 /100 | #159 | Good 11.4% |
| French Canadians | 69.5 /100 | #160 | Good 11.4% |
| Pennsylvania Germans | 68.4 /100 | #161 | Good 11.4% |
| Alsatians | 68.0 /100 | #162 | Good 11.4% |