Subsaharan African vs American Child Poverty Among Boys Under 16
COMPARE
Subsaharan African
American
Child Poverty Among Boys Under 16
Child Poverty Among Boys Under 16 Comparison
Sub-Saharan Africans
Americans
20.0%
CHILD POVERTY AMONG BOYS UNDER 16
0.0/ 100
METRIC RATING
276th/ 347
METRIC RANK
18.6%
CHILD POVERTY AMONG BOYS UNDER 16
0.9/ 100
METRIC RATING
235th/ 347
METRIC RANK
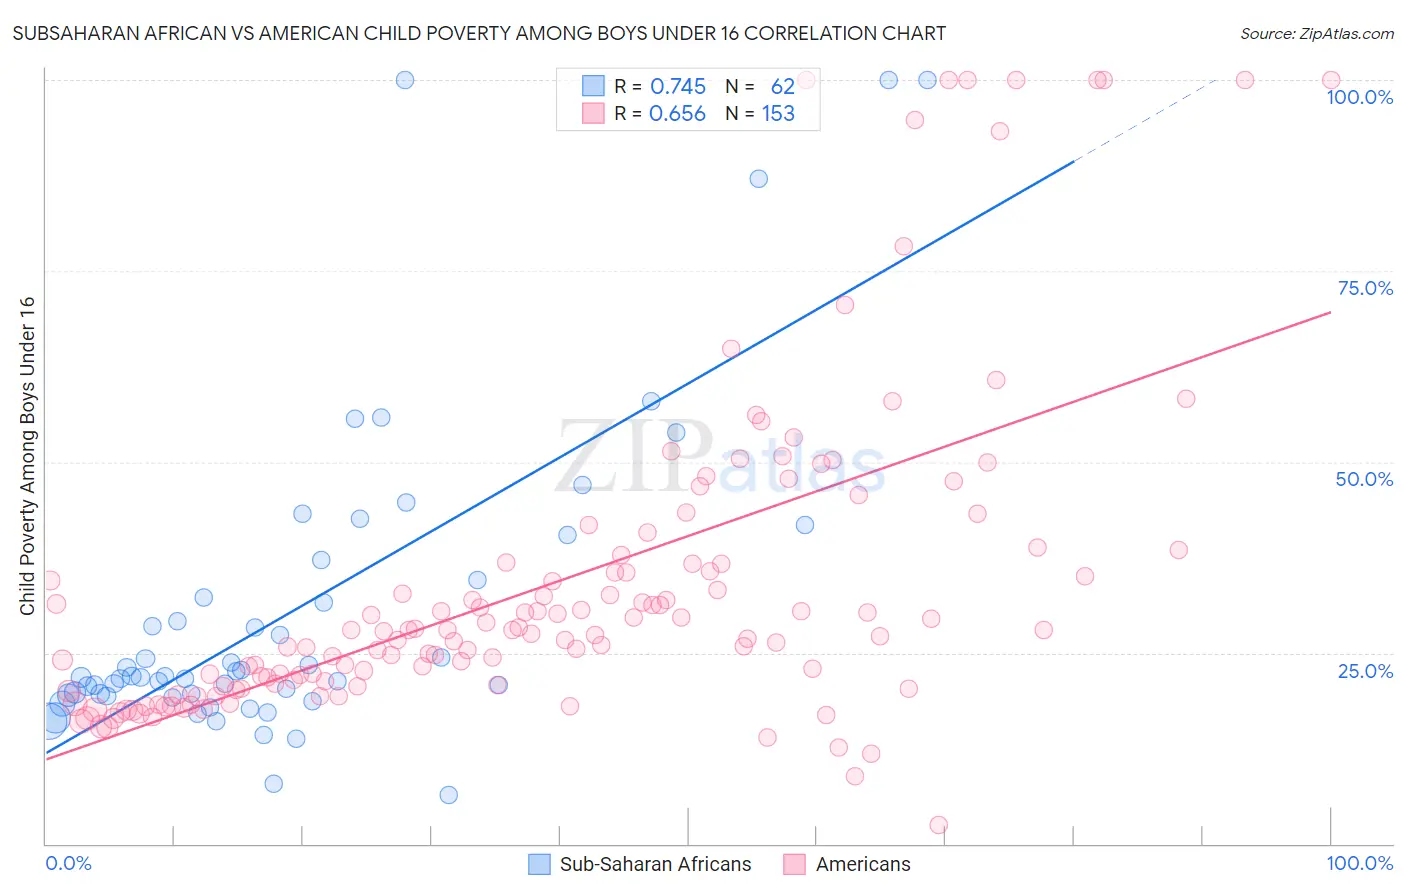
Subsaharan African vs American Child Poverty Among Boys Under 16 Correlation Chart
The statistical analysis conducted on geographies consisting of 497,613,414 people shows a strong positive correlation between the proportion of Sub-Saharan Africans and poverty level among boys under the age of 16 in the United States with a correlation coefficient (R) of 0.745 and weighted average of 20.0%. Similarly, the statistical analysis conducted on geographies consisting of 559,344,649 people shows a significant positive correlation between the proportion of Americans and poverty level among boys under the age of 16 in the United States with a correlation coefficient (R) of 0.656 and weighted average of 18.6%, a difference of 7.5%.
Child Poverty Among Boys Under 16 Correlation Summary
| Measurement | Subsaharan African | American |
| Minimum | 6.5% | 2.5% |
| Maximum | 100.0% | 100.0% |
| Range | 93.5% | 97.5% |
| Mean | 30.6% | 33.9% |
| Median | 21.9% | 27.8% |
| Interquartile 25% (IQ1) | 19.4% | 20.8% |
| Interquartile 75% (IQ3) | 34.6% | 36.7% |
| Interquartile Range (IQR) | 15.2% | 16.0% |
| Standard Deviation (Sample) | 21.0% | 21.1% |
| Standard Deviation (Population) | 20.8% | 21.1% |
Similar Demographics by Child Poverty Among Boys Under 16
Demographics Similar to Sub-Saharan Africans by Child Poverty Among Boys Under 16
In terms of child poverty among boys under 16, the demographic groups most similar to Sub-Saharan Africans are Immigrants from Barbados (20.0%, a difference of 0.10%), Immigrants from West Indies (20.0%, a difference of 0.12%), Jamaican (20.0%, a difference of 0.17%), Bangladeshi (20.0%, a difference of 0.25%), and Immigrants from Bangladesh (19.9%, a difference of 0.29%).
| Demographics | Rating | Rank | Child Poverty Among Boys Under 16 |
| Immigrants | Cabo Verde | 0.1 /100 | #269 | Tragic 19.7% |
| Cherokee | 0.1 /100 | #270 | Tragic 19.7% |
| Chickasaw | 0.1 /100 | #271 | Tragic 19.8% |
| Immigrants | Ecuador | 0.1 /100 | #272 | Tragic 19.8% |
| Belizeans | 0.1 /100 | #273 | Tragic 19.9% |
| Immigrants | Bangladesh | 0.0 /100 | #274 | Tragic 19.9% |
| Jamaicans | 0.0 /100 | #275 | Tragic 20.0% |
| Sub-Saharan Africans | 0.0 /100 | #276 | Tragic 20.0% |
| Immigrants | Barbados | 0.0 /100 | #277 | Tragic 20.0% |
| Immigrants | West Indies | 0.0 /100 | #278 | Tragic 20.0% |
| Bangladeshis | 0.0 /100 | #279 | Tragic 20.0% |
| Central Americans | 0.0 /100 | #280 | Tragic 20.1% |
| Immigrants | Zaire | 0.0 /100 | #281 | Tragic 20.1% |
| Comanche | 0.0 /100 | #282 | Tragic 20.1% |
| Immigrants | Jamaica | 0.0 /100 | #283 | Tragic 20.1% |
Demographics Similar to Americans by Child Poverty Among Boys Under 16
In terms of child poverty among boys under 16, the demographic groups most similar to Americans are Sudanese (18.6%, a difference of 0.090%), Immigrants from Eritrea (18.6%, a difference of 0.24%), Immigrants from Laos (18.7%, a difference of 0.46%), Nigerian (18.5%, a difference of 0.50%), and Cape Verdean (18.7%, a difference of 0.70%).
| Demographics | Rating | Rank | Child Poverty Among Boys Under 16 |
| Immigrants | Nonimmigrants | 2.2 /100 | #228 | Tragic 18.2% |
| Immigrants | Micronesia | 1.8 /100 | #229 | Tragic 18.3% |
| Fijians | 1.8 /100 | #230 | Tragic 18.3% |
| Nicaraguans | 1.4 /100 | #231 | Tragic 18.4% |
| Marshallese | 1.3 /100 | #232 | Tragic 18.4% |
| Immigrants | Nigeria | 1.2 /100 | #233 | Tragic 18.4% |
| Nigerians | 1.1 /100 | #234 | Tragic 18.5% |
| Americans | 0.9 /100 | #235 | Tragic 18.6% |
| Sudanese | 0.9 /100 | #236 | Tragic 18.6% |
| Immigrants | Eritrea | 0.8 /100 | #237 | Tragic 18.6% |
| Immigrants | Laos | 0.8 /100 | #238 | Tragic 18.7% |
| Cape Verdeans | 0.7 /100 | #239 | Tragic 18.7% |
| Immigrants | Cuba | 0.6 /100 | #240 | Tragic 18.8% |
| Immigrants | Sudan | 0.6 /100 | #241 | Tragic 18.8% |
| Ghanaians | 0.5 /100 | #242 | Tragic 18.9% |