Sri Lankan vs Pueblo Family Poverty
COMPARE
Sri Lankan
Pueblo
Family Poverty
Family Poverty Comparison
Sri Lankans
Pueblo
8.5%
FAMILY POVERTY
86.6/ 100
METRIC RATING
133rd/ 347
METRIC RANK
17.0%
FAMILY POVERTY
0.0/ 100
METRIC RATING
340th/ 347
METRIC RANK
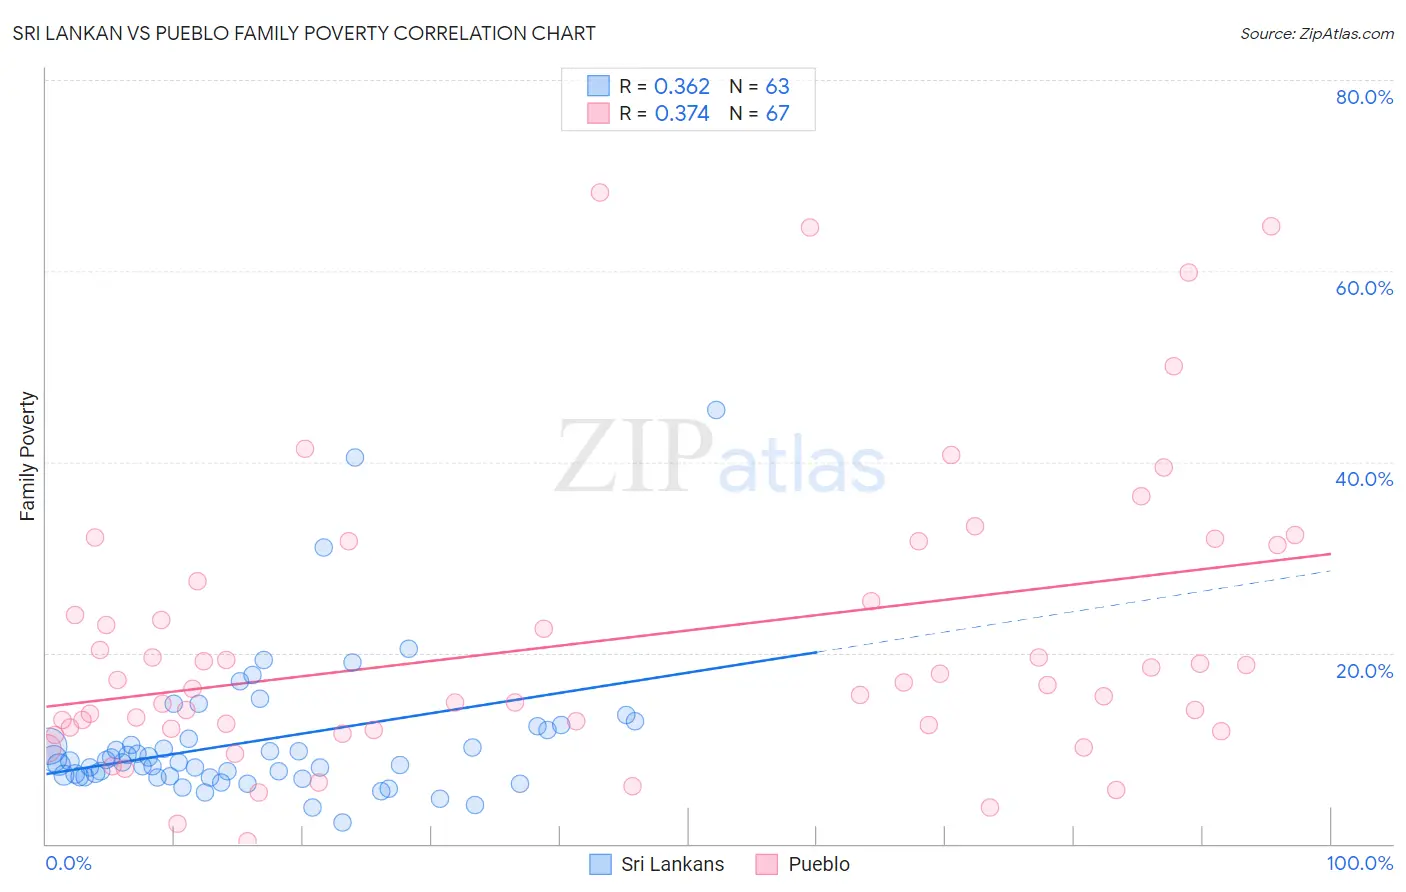
Sri Lankan vs Pueblo Family Poverty Correlation Chart
The statistical analysis conducted on geographies consisting of 439,246,520 people shows a mild positive correlation between the proportion of Sri Lankans and poverty level among families in the United States with a correlation coefficient (R) of 0.362 and weighted average of 8.5%. Similarly, the statistical analysis conducted on geographies consisting of 120,003,274 people shows a mild positive correlation between the proportion of Pueblo and poverty level among families in the United States with a correlation coefficient (R) of 0.374 and weighted average of 17.0%, a difference of 100.9%.
Family Poverty Correlation Summary
| Measurement | Sri Lankan | Pueblo |
| Minimum | 2.3% | 0.20% |
| Maximum | 45.5% | 68.2% |
| Range | 43.2% | 68.0% |
| Mean | 10.8% | 21.1% |
| Median | 8.6% | 16.7% |
| Interquartile 25% (IQ1) | 7.0% | 12.0% |
| Interquartile 75% (IQ3) | 11.9% | 27.5% |
| Interquartile Range (IQR) | 4.8% | 15.5% |
| Standard Deviation (Sample) | 7.5% | 15.0% |
| Standard Deviation (Population) | 7.4% | 14.8% |
Similar Demographics by Family Poverty
Demographics Similar to Sri Lankans by Family Poverty
In terms of family poverty, the demographic groups most similar to Sri Lankans are Chilean (8.5%, a difference of 0.010%), Immigrants from Malaysia (8.5%, a difference of 0.050%), Immigrants from Brazil (8.5%, a difference of 0.090%), Immigrants from Southern Europe (8.5%, a difference of 0.17%), and Immigrants from Argentina (8.4%, a difference of 0.50%).
| Demographics | Rating | Rank | Family Poverty |
| Icelanders | 90.3 /100 | #126 | Exceptional 8.3% |
| Immigrants | Hungary | 89.9 /100 | #127 | Excellent 8.4% |
| Argentineans | 89.6 /100 | #128 | Excellent 8.4% |
| Portuguese | 89.2 /100 | #129 | Excellent 8.4% |
| Immigrants | Bosnia and Herzegovina | 88.6 /100 | #130 | Excellent 8.4% |
| Puget Sound Salish | 88.6 /100 | #131 | Excellent 8.4% |
| Immigrants | Argentina | 88.2 /100 | #132 | Excellent 8.4% |
| Sri Lankans | 86.6 /100 | #133 | Excellent 8.5% |
| Chileans | 86.6 /100 | #134 | Excellent 8.5% |
| Immigrants | Malaysia | 86.5 /100 | #135 | Excellent 8.5% |
| Immigrants | Brazil | 86.3 /100 | #136 | Excellent 8.5% |
| Immigrants | Southern Europe | 86.0 /100 | #137 | Excellent 8.5% |
| Armenians | 84.6 /100 | #138 | Excellent 8.5% |
| Immigrants | Nepal | 84.2 /100 | #139 | Excellent 8.5% |
| Immigrants | Kazakhstan | 84.1 /100 | #140 | Excellent 8.5% |
Demographics Similar to Pueblo by Family Poverty
In terms of family poverty, the demographic groups most similar to Pueblo are Lumbee (17.0%, a difference of 0.070%), Yuman (16.6%, a difference of 2.1%), Immigrants from Yemen (17.5%, a difference of 2.8%), Crow (16.1%, a difference of 5.4%), and Hopi (15.9%, a difference of 6.6%).
| Demographics | Rating | Rank | Family Poverty |
| Immigrants | Dominican Republic | 0.0 /100 | #333 | Tragic 14.4% |
| Houma | 0.0 /100 | #334 | Tragic 14.6% |
| Apache | 0.0 /100 | #335 | Tragic 14.7% |
| Sioux | 0.0 /100 | #336 | Tragic 15.9% |
| Hopi | 0.0 /100 | #337 | Tragic 15.9% |
| Crow | 0.0 /100 | #338 | Tragic 16.1% |
| Yuman | 0.0 /100 | #339 | Tragic 16.6% |
| Pueblo | 0.0 /100 | #340 | Tragic 17.0% |
| Lumbee | 0.0 /100 | #341 | Tragic 17.0% |
| Immigrants | Yemen | 0.0 /100 | #342 | Tragic 17.5% |
| Pima | 0.0 /100 | #343 | Tragic 18.4% |
| Yup'ik | 0.0 /100 | #344 | Tragic 18.7% |
| Navajo | 0.0 /100 | #345 | Tragic 18.8% |
| Puerto Ricans | 0.0 /100 | #346 | Tragic 20.3% |
| Tohono O'odham | 0.0 /100 | #347 | Tragic 20.4% |