Sri Lankan vs Immigrants from Switzerland Seniors Poverty Over the Age of 75
COMPARE
Sri Lankan
Immigrants from Switzerland
Seniors Poverty Over the Age of 75
Seniors Poverty Over the Age of 75 Comparison
Sri Lankans
Immigrants from Switzerland
12.4%
SENIORS POVERTY OVER THE AGE OF 75
32.3/ 100
METRIC RATING
186th/ 347
METRIC RANK
12.1%
SENIORS POVERTY OVER THE AGE OF 75
54.5/ 100
METRIC RATING
167th/ 347
METRIC RANK
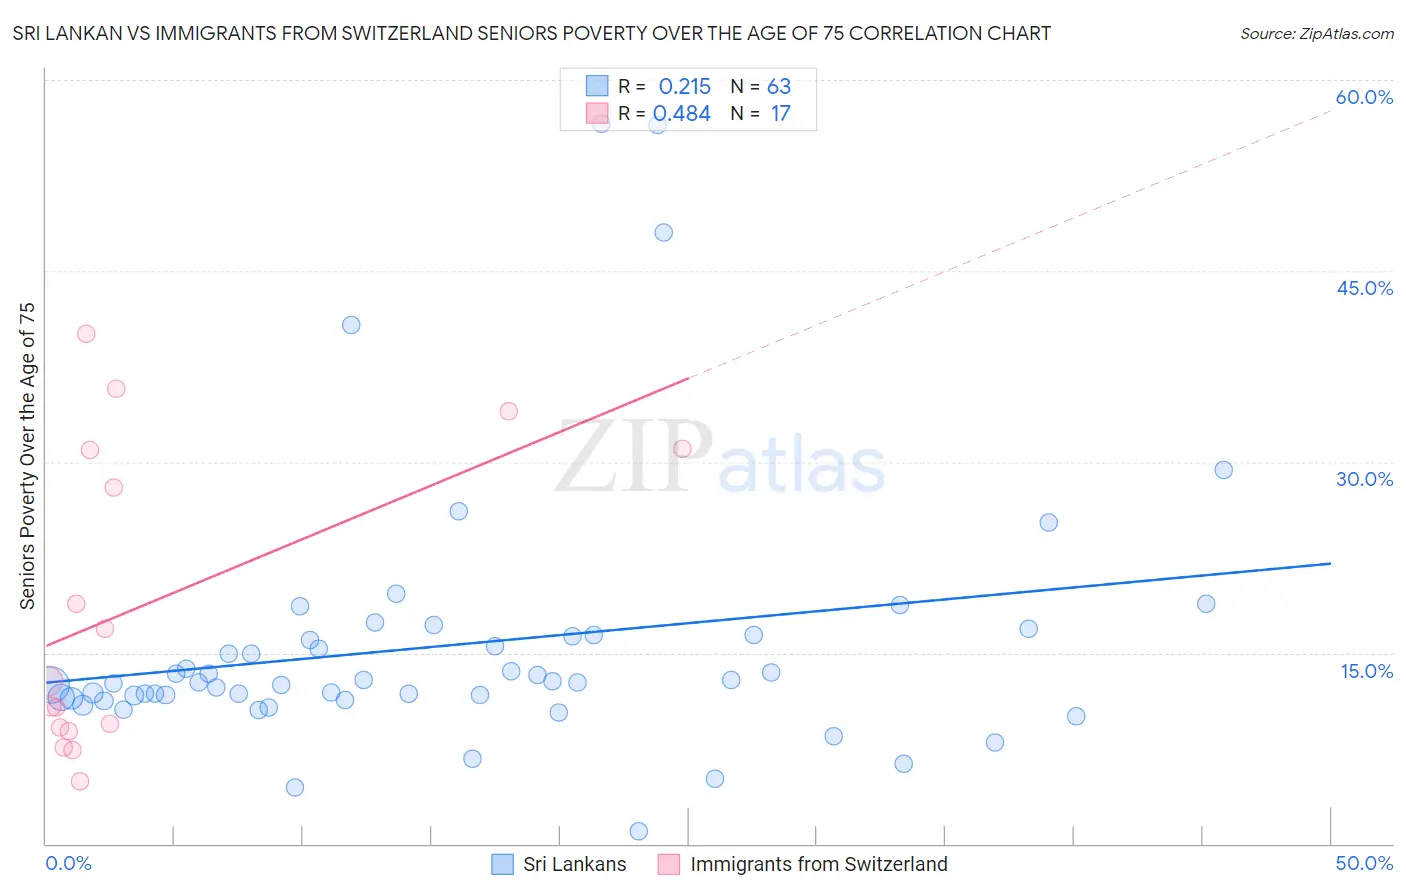
Sri Lankan vs Immigrants from Switzerland Seniors Poverty Over the Age of 75 Correlation Chart
The statistical analysis conducted on geographies consisting of 434,587,181 people shows a weak positive correlation between the proportion of Sri Lankans and poverty level among seniors over the age of 75 in the United States with a correlation coefficient (R) of 0.215 and weighted average of 12.4%. Similarly, the statistical analysis conducted on geographies consisting of 147,293,011 people shows a moderate positive correlation between the proportion of Immigrants from Switzerland and poverty level among seniors over the age of 75 in the United States with a correlation coefficient (R) of 0.484 and weighted average of 12.1%, a difference of 1.9%.
Seniors Poverty Over the Age of 75 Correlation Summary
| Measurement | Sri Lankan | Immigrants from Switzerland |
| Minimum | 1.0% | 4.9% |
| Maximum | 56.5% | 40.1% |
| Range | 55.5% | 35.2% |
| Mean | 15.6% | 18.6% |
| Median | 12.7% | 12.8% |
| Interquartile 25% (IQ1) | 11.4% | 9.0% |
| Interquartile 75% (IQ3) | 16.4% | 31.0% |
| Interquartile Range (IQR) | 5.0% | 22.0% |
| Standard Deviation (Sample) | 10.4% | 11.9% |
| Standard Deviation (Population) | 10.3% | 11.5% |
Demographics Similar to Sri Lankans and Immigrants from Switzerland by Seniors Poverty Over the Age of 75
In terms of seniors poverty over the age of 75, the demographic groups most similar to Sri Lankans are Immigrants from Malaysia (12.3%, a difference of 0.31%), Kiowa (12.3%, a difference of 0.32%), Laotian (12.3%, a difference of 0.52%), German Russian (12.3%, a difference of 0.79%), and Immigrants from Australia (12.2%, a difference of 1.0%). Similarly, the demographic groups most similar to Immigrants from Switzerland are Egyptian (12.1%, a difference of 0.020%), Immigrants from Syria (12.2%, a difference of 0.050%), Immigrants from Egypt (12.2%, a difference of 0.070%), Immigrants from Thailand (12.2%, a difference of 0.21%), and Spaniard (12.2%, a difference of 0.24%).
| Demographics | Rating | Rank | Seniors Poverty Over the Age of 75 |
| Egyptians | 54.8 /100 | #166 | Average 12.1% |
| Immigrants | Switzerland | 54.5 /100 | #167 | Average 12.1% |
| Immigrants | Syria | 53.9 /100 | #168 | Average 12.2% |
| Immigrants | Egypt | 53.7 /100 | #169 | Average 12.2% |
| Immigrants | Thailand | 52.0 /100 | #170 | Average 12.2% |
| Spaniards | 51.6 /100 | #171 | Average 12.2% |
| Immigrants | Fiji | 51.5 /100 | #172 | Average 12.2% |
| Arabs | 50.5 /100 | #173 | Average 12.2% |
| Immigrants | Europe | 50.0 /100 | #174 | Average 12.2% |
| Immigrants | Saudi Arabia | 49.5 /100 | #175 | Average 12.2% |
| Immigrants | Iran | 48.1 /100 | #176 | Average 12.2% |
| Immigrants | Asia | 47.8 /100 | #177 | Average 12.2% |
| Immigrants | Nonimmigrants | 46.8 /100 | #178 | Average 12.2% |
| Mongolians | 45.5 /100 | #179 | Average 12.2% |
| Immigrants | South Eastern Asia | 44.3 /100 | #180 | Average 12.2% |
| Immigrants | Australia | 44.2 /100 | #181 | Average 12.2% |
| German Russians | 41.4 /100 | #182 | Average 12.3% |
| Laotians | 38.2 /100 | #183 | Fair 12.3% |
| Kiowa | 36.0 /100 | #184 | Fair 12.3% |
| Immigrants | Malaysia | 35.8 /100 | #185 | Fair 12.3% |
| Sri Lankans | 32.3 /100 | #186 | Fair 12.4% |