Sri Lankan vs Immigrants from Poland Seniors Poverty Over the Age of 65

COMPARE

Sri Lankan
Race
Ancestry
AfghanAfricanAlaska NativeAlaskan AthabascanAlbanianAleutAlsatianAmericanApacheArabArapahoArgentineanArmenianAssyrian/Chaldean/SyriacAustralianAustrianBahamianBangladeshiBarbadianBasqueBelgianBelizeanBermudanBhutaneseBlackfeetBolivianBrazilianBritishBritish West IndianBulgarianBurmeseCajunCambodianCanadianCape VerdeanCarpatho RusynCelticCentral AmericanCentral American IndianCherokeeCheyenneChickasawChileanChineseChippewaChoctawColombianColvilleComancheCosta RicanCreeCreekCroatianCrowCubanCypriotCzechCzechoslovakianDanishDelawareDominicanDutchDutch West IndianEastern EuropeanEcuadorianEgyptianEnglishEstonianEthiopianEuropeanFijianFilipinoFinnishFrenchFrench American IndianFrench CanadianGermanGerman RussianGhanaianGreekGuamanian/ChamorroGuatemalanGuyaneseHaitianHmongHonduranHopiHoumaHungarianIcelanderIndian (Asian)IndonesianInupiatIranianIraqiIrishIroquoisIsraeliItalianJamaicanJapaneseJordanianKenyanKiowaKoreanLaotianLatvianLebaneseLiberianLithuanianLumbeeLuxembourgerMacedonianMalaysianMalteseMarshalleseMenomineeMexicanMexican American IndianMongolianMoroccanNative HawaiianNavajoNepaleseNew ZealanderNicaraguanNigerianNorthern EuropeanNorwegianOkinawanOsageOttawaPaiutePakistaniPalestinianPanamanianParaguayanPennsylvania GermanPeruvianPimaPolishPortuguesePotawatomiPuebloPuerto RicanPuget Sound SalishRomanianRussianSalvadoranSamoanScandinavianScotch-IrishScottishSeminoleSenegaleseSerbianShoshoneSierra LeoneanSiouxSlavicSlovakSloveneSomaliSouth AfricanSouth AmericanSouth American IndianSoviet UnionSpaniardSpanishSpanish AmericanSpanish American IndianSri LankanSubsaharan AfricanSudaneseSwedishSwissSyrianTaiwaneseThaiTlingit-HaidaTohono O'OdhamTonganTrinidadian and TobagonianTsimshianTurkishU.S. Virgin IslanderUgandanUkrainianUruguayanUteVenezuelanVietnameseWelshWest IndianYakamaYaquiYugoslavianYumanYup'ikZimbabwean
Immigration
NonimmigrantsImmigrantsAfghanistanAfricaAlbaniaArgentinaArmeniaAsiaAustraliaAustriaBahamasBangladeshBarbadosBelarusBelgiumBelizeBoliviaBosnia and HerzegovinaBrazilBulgariaBurma/MyanmarCabo VerdeCambodiaCameroonCanadaCaribbeanCentral AmericaChileChinaColombiaCongoCosta RicaCroatiaCubaCzechoslovakiaDenmarkDominicaDominican RepublicEastern AfricaEastern AsiaEastern EuropeEcuadorEgyptEl SalvadorEnglandEritreaEthiopiaEuropeFijiFranceGermanyGhanaGreeceGrenadaGuatemalaGuyanaHaitiHondurasHong KongHungaryIndiaIndonesiaIranIraqIrelandIsraelItalyJamaicaJapanJordanKazakhstanKenyaKoreaKuwaitLaosLatin AmericaLatviaLebanonLiberiaLithuaniaMalaysiaMexicoMicronesiaMiddle AfricaMoldovaMoroccoNepalNetherlandsNicaraguaNigeriaNorth AmericaNorth MacedoniaNorthern AfricaNorthern EuropeNorwayOceaniaPakistanPanamaPeruPhilippinesPortugalRomaniaRussiaSaudi ArabiaScotlandSenegalSerbiaSierra LeoneSingaporeSomaliaSouth AfricaSouth AmericaSouth Central AsiaSouth Eastern AsiaSouthern EuropeSpainSri LankaSt. Vincent and the GrenadinesSudanSwedenSwitzerlandSyriaTaiwanThailandTrinidad and TobagoTurkeyUgandaUkraineUruguayUzbekistanVenezuelaVietnamWest IndiesWestern AfricaWestern AsiaWestern EuropeYemenZaireZimbabweAzores
Immigrants from Poland
Race
Ancestry
AfghanAfricanAlaska NativeAlaskan AthabascanAlbanianAleutAlsatianAmericanApacheArabArapahoArgentineanArmenianAssyrian/Chaldean/SyriacAustralianAustrianBahamianBangladeshiBarbadianBasqueBelgianBelizeanBermudanBhutaneseBlackfeetBolivianBrazilianBritishBritish West IndianBulgarianBurmeseCajunCambodianCanadianCape VerdeanCarpatho RusynCelticCentral AmericanCentral American IndianCherokeeCheyenneChickasawChileanChineseChippewaChoctawColombianColvilleComancheCosta RicanCreeCreekCroatianCrowCubanCypriotCzechCzechoslovakianDanishDelawareDominicanDutchDutch West IndianEastern EuropeanEcuadorianEgyptianEnglishEstonianEthiopianEuropeanFijianFilipinoFinnishFrenchFrench American IndianFrench CanadianGermanGerman RussianGhanaianGreekGuamanian/ChamorroGuatemalanGuyaneseHaitianHmongHonduranHopiHoumaHungarianIcelanderIndian (Asian)IndonesianInupiatIranianIraqiIrishIroquoisIsraeliItalianJamaicanJapaneseJordanianKenyanKiowaKoreanLaotianLatvianLebaneseLiberianLithuanianLumbeeLuxembourgerMacedonianMalaysianMalteseMarshalleseMenomineeMexicanMexican American IndianMongolianMoroccanNative HawaiianNavajoNepaleseNew ZealanderNicaraguanNigerianNorthern EuropeanNorwegianOkinawanOsageOttawaPaiutePakistaniPalestinianPanamanianParaguayanPennsylvania GermanPeruvianPimaPolishPortuguesePotawatomiPuebloPuerto RicanPuget Sound SalishRomanianRussianSalvadoranSamoanScandinavianScotch-IrishScottishSeminoleSenegaleseSerbianShoshoneSierra LeoneanSiouxSlavicSlovakSloveneSomaliSouth AfricanSouth AmericanSouth American IndianSoviet UnionSpaniardSpanishSpanish AmericanSpanish American IndianSubsaharan AfricanSudaneseSwedishSwissSyrianTaiwaneseThaiTlingit-HaidaTohono O'OdhamTonganTrinidadian and TobagonianTsimshianTurkishU.S. Virgin IslanderUgandanUkrainianUruguayanUteVenezuelanVietnameseWelshWest IndianYakamaYaquiYugoslavianYumanYup'ikZimbabwean
Immigration
NonimmigrantsImmigrantsAfghanistanAfricaAlbaniaArgentinaArmeniaAsiaAustraliaAustriaBahamasBangladeshBarbadosBelarusBelgiumBelizeBoliviaBosnia and HerzegovinaBrazilBulgariaBurma/MyanmarCabo VerdeCambodiaCameroonCanadaCaribbeanCentral AmericaChileChinaColombiaCongoCosta RicaCroatiaCubaCzechoslovakiaDenmarkDominicaDominican RepublicEastern AfricaEastern AsiaEastern EuropeEcuadorEgyptEl SalvadorEnglandEritreaEthiopiaEuropeFijiFranceGermanyGhanaGreeceGrenadaGuatemalaGuyanaHaitiHondurasHong KongHungaryIndiaIndonesiaIranIraqIrelandIsraelItalyJamaicaJapanJordanKazakhstanKenyaKoreaKuwaitLaosLatin AmericaLatviaLebanonLiberiaLithuaniaMalaysiaMexicoMicronesiaMiddle AfricaMoldovaMoroccoNepalNetherlandsNicaraguaNigeriaNorth AmericaNorth MacedoniaNorthern AfricaNorthern EuropeNorwayOceaniaPakistanPanamaPeruPhilippinesPolandPortugalRomaniaRussiaSaudi ArabiaScotlandSenegalSerbiaSierra LeoneSingaporeSomaliaSouth AfricaSouth AmericaSouth Central AsiaSouth Eastern AsiaSouthern EuropeSpainSri LankaSt. Vincent and the GrenadinesSudanSwedenSwitzerlandSyriaTaiwanThailandTrinidad and TobagoTurkeyUgandaUkraineUruguayUzbekistanVenezuelaVietnamWest IndiesWestern AfricaWestern AsiaWestern EuropeYemenZaireZimbabweAzores
Seniors Poverty Over the Age of 65
Income
Poverty
Unemployment
Labor Participation
Family Structure
Vehicle Availability
Education Level
Disability

Seniors Poverty Over the Age of 65 Comparison

Sri Lankans

Immigrants from Poland

Average
Exceptional
10.9%
SENIORS POVERTY OVER THE AGE OF 65
56.8/ 100
METRIC RATING
169th/ 347
METRIC RANK
10.1%
SENIORS POVERTY OVER THE AGE OF 65
97.2/ 100
METRIC RATING
83rd/ 347
METRIC RANK

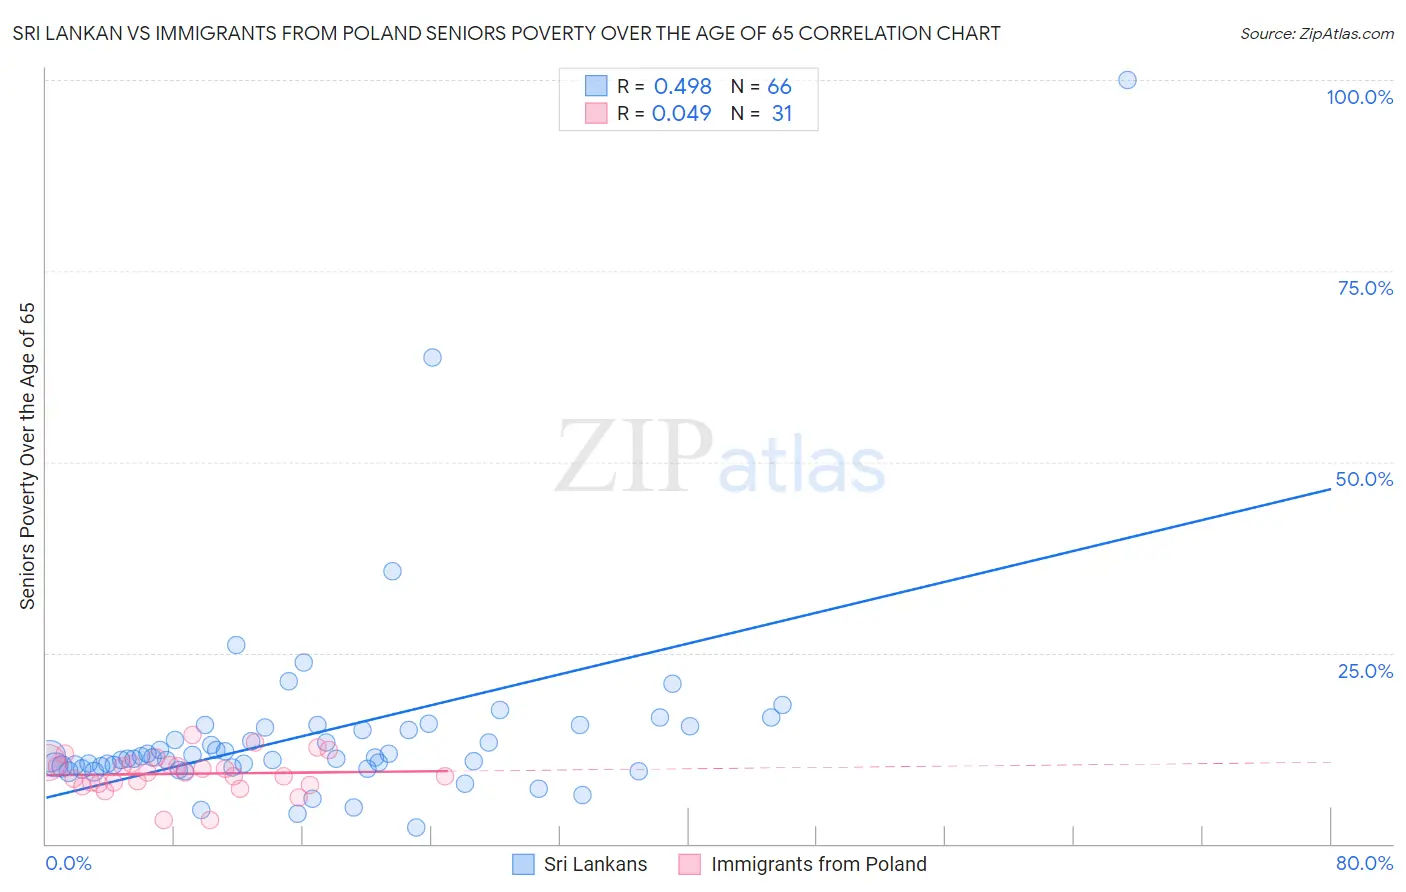
Sri Lankan vs Immigrants from Poland Seniors Poverty Over the Age of 65 Correlation Chart

The statistical analysis conducted on geographies consisting of 438,555,706 people shows a moderate positive correlation between the proportion of Sri Lankans and poverty level among seniors over the age of 65 in the United States with a correlation coefficient (R) of 0.498 and weighted average of 10.9%. Similarly, the statistical analysis conducted on geographies consisting of 304,182,133 people shows no correlation between the proportion of Immigrants from Poland and poverty level among seniors over the age of 65 in the United States with a correlation coefficient (R) of 0.049 and weighted average of 10.1%, a difference of 7.9%.
Sri Lankan vs Immigrants from Poland Seniors Poverty Over the Age of 65

Seniors Poverty Over the Age of 65 Correlation Summary

MeasurementSri LankanImmigrants from Poland
Minimum2.1%3.0%
Maximum100.0%14.3%
Range97.9%11.2%
Mean14.5%9.2%
Median11.3%9.3%
Interquartile 25% (IQ1)10.1%7.8%
Interquartile 75% (IQ3)15.2%10.5%
Interquartile Range (IQR)5.1%2.7%
Standard Deviation (Sample)13.4%2.5%
Standard Deviation (Population)13.3%2.5%

Similar Demographics by Seniors Poverty Over the Age of 65

Demographics Similar to Sri Lankans by Seniors Poverty Over the Age of 65

In terms of seniors poverty over the age of 65, the demographic groups most similar to Sri Lankans are Immigrants from Eastern Europe (10.9%, a difference of 0.090%), Mongolian (10.9%, a difference of 0.10%), Nonimmigrants (10.9%, a difference of 0.16%), Immigrants from Syria (10.9%, a difference of 0.19%), and Alaska Native (10.8%, a difference of 0.32%).
DemographicsRating | RankSeniors Poverty Over the Age of 65
Immigrants | Indonesia
64.8
/100
|
#162
Good
10.8%
Tsimshian
64.5
/100
|
#163
Good
10.8%
Potawatomi
62.6
/100
|
#164
Good
10.8%
Immigrants | South Eastern Asia
62.1
/100
|
#165
Good
10.8%
Malaysians
62.0
/100
|
#166
Good
10.8%
Alaska Natives
60.3
/100
|
#167
Good
10.8%
Mongolians
58.0
/100
|
#168
Average
10.9%
Sri Lankans
56.8
/100
|
#169
Average
10.9%
Immigrants | Eastern Europe
55.8
/100
|
#170
Average
10.9%
Immigrants | Nonimmigrants
55.1
/100
|
#171
Average
10.9%
Immigrants | Syria
54.7
/100
|
#172
Average
10.9%
Spaniards
50.7
/100
|
#173
Average
10.9%
Immigrants | Sudan
50.0
/100
|
#174
Average
10.9%
Creek
49.6
/100
|
#175
Average
10.9%
Immigrants | Malaysia
47.9
/100
|
#176
Average
11.0%

Demographics Similar to Immigrants from Poland by Seniors Poverty Over the Age of 65

In terms of seniors poverty over the age of 65, the demographic groups most similar to Immigrants from Poland are Immigrants from Bolivia (10.1%, a difference of 0.030%), Immigrants from Afghanistan (10.1%, a difference of 0.030%), Immigrants from Nepal (10.1%, a difference of 0.030%), Romanian (10.1%, a difference of 0.050%), and Burmese (10.1%, a difference of 0.060%).
DemographicsRating | RankSeniors Poverty Over the Age of 65
New Zealanders
97.7
/100
|
#76
Exceptional
10.0%
Immigrants | South Africa
97.7
/100
|
#77
Exceptional
10.0%
Whites/Caucasians
97.5
/100
|
#78
Exceptional
10.0%
Immigrants | Ireland
97.5
/100
|
#79
Exceptional
10.0%
Koreans
97.4
/100
|
#80
Exceptional
10.1%
Immigrants | Sri Lanka
97.3
/100
|
#81
Exceptional
10.1%
Immigrants | Bolivia
97.3
/100
|
#82
Exceptional
10.1%
Immigrants | Poland
97.2
/100
|
#83
Exceptional
10.1%
Immigrants | Afghanistan
97.2
/100
|
#84
Exceptional
10.1%
Immigrants | Nepal
97.2
/100
|
#85
Exceptional
10.1%
Romanians
97.2
/100
|
#86
Exceptional
10.1%
Burmese
97.2
/100
|
#87
Exceptional
10.1%
Jordanians
97.1
/100
|
#88
Exceptional
10.1%
Immigrants | Bulgaria
97.0
/100
|
#89
Exceptional
10.1%
Ukrainians
96.9
/100
|
#90
Exceptional
10.1%