Sri Lankan vs Immigrants from Albania Single Father Poverty
COMPARE
Sri Lankan
Immigrants from Albania
Single Father Poverty
Single Father Poverty Comparison
Sri Lankans
Immigrants from Albania
14.2%
SINGLE FATHER POVERTY
100.0/ 100
METRIC RATING
15th/ 347
METRIC RANK
17.2%
SINGLE FATHER POVERTY
0.7/ 100
METRIC RATING
257th/ 347
METRIC RANK
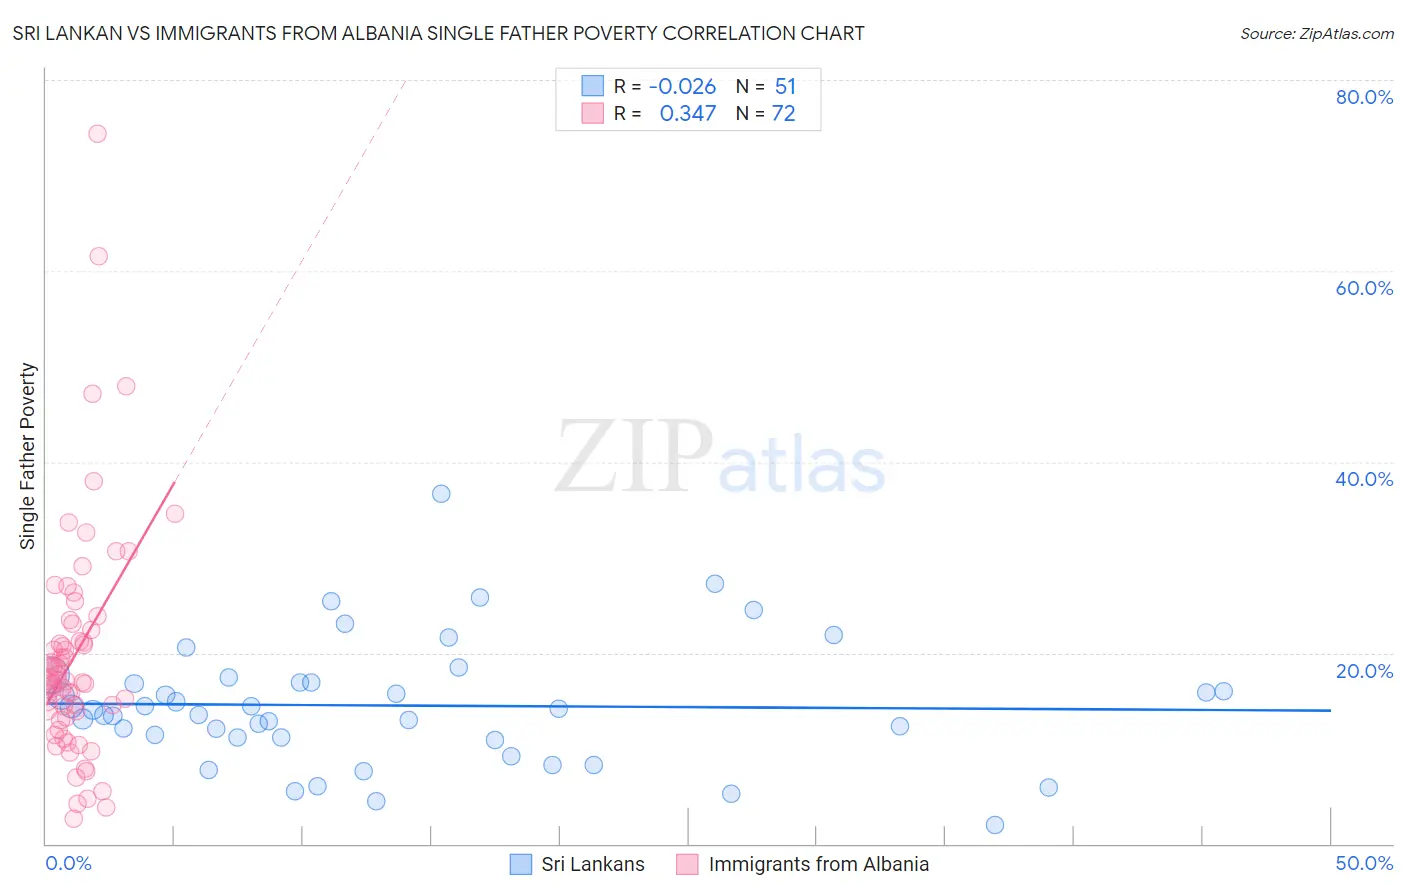
Sri Lankan vs Immigrants from Albania Single Father Poverty Correlation Chart
The statistical analysis conducted on geographies consisting of 343,642,421 people shows no correlation between the proportion of Sri Lankans and poverty level among single fathers in the United States with a correlation coefficient (R) of -0.026 and weighted average of 14.2%. Similarly, the statistical analysis conducted on geographies consisting of 101,642,932 people shows a mild positive correlation between the proportion of Immigrants from Albania and poverty level among single fathers in the United States with a correlation coefficient (R) of 0.347 and weighted average of 17.2%, a difference of 21.4%.
Single Father Poverty Correlation Summary
| Measurement | Sri Lankan | Immigrants from Albania |
| Minimum | 2.0% | 2.6% |
| Maximum | 36.7% | 74.4% |
| Range | 34.7% | 71.7% |
| Mean | 14.5% | 19.8% |
| Median | 14.0% | 17.1% |
| Interquartile 25% (IQ1) | 11.1% | 13.5% |
| Interquartile 75% (IQ3) | 16.9% | 22.7% |
| Interquartile Range (IQR) | 5.8% | 9.2% |
| Standard Deviation (Sample) | 6.5% | 12.2% |
| Standard Deviation (Population) | 6.5% | 12.1% |
Similar Demographics by Single Father Poverty
Demographics Similar to Sri Lankans by Single Father Poverty
In terms of single father poverty, the demographic groups most similar to Sri Lankans are Immigrants from Vietnam (14.1%, a difference of 0.050%), Immigrants from Iran (14.2%, a difference of 0.20%), Immigrants from Hong Kong (14.2%, a difference of 0.65%), Soviet Union (14.3%, a difference of 0.68%), and Immigrants from Iraq (14.3%, a difference of 0.72%).
| Demographics | Rating | Rank | Single Father Poverty |
| Samoans | 100.0 /100 | #8 | Exceptional 13.8% |
| Afghans | 100.0 /100 | #9 | Exceptional 14.0% |
| Koreans | 100.0 /100 | #10 | Exceptional 14.0% |
| Filipinos | 100.0 /100 | #11 | Exceptional 14.0% |
| Immigrants | India | 100.0 /100 | #12 | Exceptional 14.0% |
| Immigrants | Philippines | 100.0 /100 | #13 | Exceptional 14.0% |
| Immigrants | Vietnam | 100.0 /100 | #14 | Exceptional 14.1% |
| Sri Lankans | 100.0 /100 | #15 | Exceptional 14.2% |
| Immigrants | Iran | 100.0 /100 | #16 | Exceptional 14.2% |
| Immigrants | Hong Kong | 100.0 /100 | #17 | Exceptional 14.2% |
| Soviet Union | 100.0 /100 | #18 | Exceptional 14.3% |
| Immigrants | Iraq | 100.0 /100 | #19 | Exceptional 14.3% |
| Immigrants | Singapore | 100.0 /100 | #20 | Exceptional 14.3% |
| Immigrants | Afghanistan | 100.0 /100 | #21 | Exceptional 14.3% |
| Taiwanese | 100.0 /100 | #22 | Exceptional 14.3% |
Demographics Similar to Immigrants from Albania by Single Father Poverty
In terms of single father poverty, the demographic groups most similar to Immigrants from Albania are Albanian (17.2%, a difference of 0.020%), Immigrants from Jamaica (17.2%, a difference of 0.050%), Immigrants from Haiti (17.2%, a difference of 0.080%), Sierra Leonean (17.2%, a difference of 0.090%), and Spaniard (17.2%, a difference of 0.20%).
| Demographics | Rating | Rank | Single Father Poverty |
| Austrians | 1.1 /100 | #250 | Tragic 17.1% |
| Luxembourgers | 1.1 /100 | #251 | Tragic 17.1% |
| Croatians | 1.0 /100 | #252 | Tragic 17.1% |
| Cree | 1.0 /100 | #253 | Tragic 17.1% |
| Immigrants | Honduras | 0.9 /100 | #254 | Tragic 17.1% |
| Sierra Leoneans | 0.8 /100 | #255 | Tragic 17.2% |
| Immigrants | Haiti | 0.8 /100 | #256 | Tragic 17.2% |
| Immigrants | Albania | 0.7 /100 | #257 | Tragic 17.2% |
| Albanians | 0.7 /100 | #258 | Tragic 17.2% |
| Immigrants | Jamaica | 0.7 /100 | #259 | Tragic 17.2% |
| Spaniards | 0.6 /100 | #260 | Tragic 17.2% |
| Swiss | 0.5 /100 | #261 | Tragic 17.3% |
| Immigrants | Zaire | 0.4 /100 | #262 | Tragic 17.3% |
| Lithuanians | 0.4 /100 | #263 | Tragic 17.3% |
| Slovenes | 0.3 /100 | #264 | Tragic 17.3% |