Spanish vs Ugandan Child Poverty Among Boys Under 16
COMPARE
Spanish
Ugandan
Child Poverty Among Boys Under 16
Child Poverty Among Boys Under 16 Comparison
Spanish
Ugandans
17.0%
CHILD POVERTY AMONG BOYS UNDER 16
20.8/ 100
METRIC RATING
195th/ 347
METRIC RANK
17.3%
CHILD POVERTY AMONG BOYS UNDER 16
12.5/ 100
METRIC RATING
204th/ 347
METRIC RANK
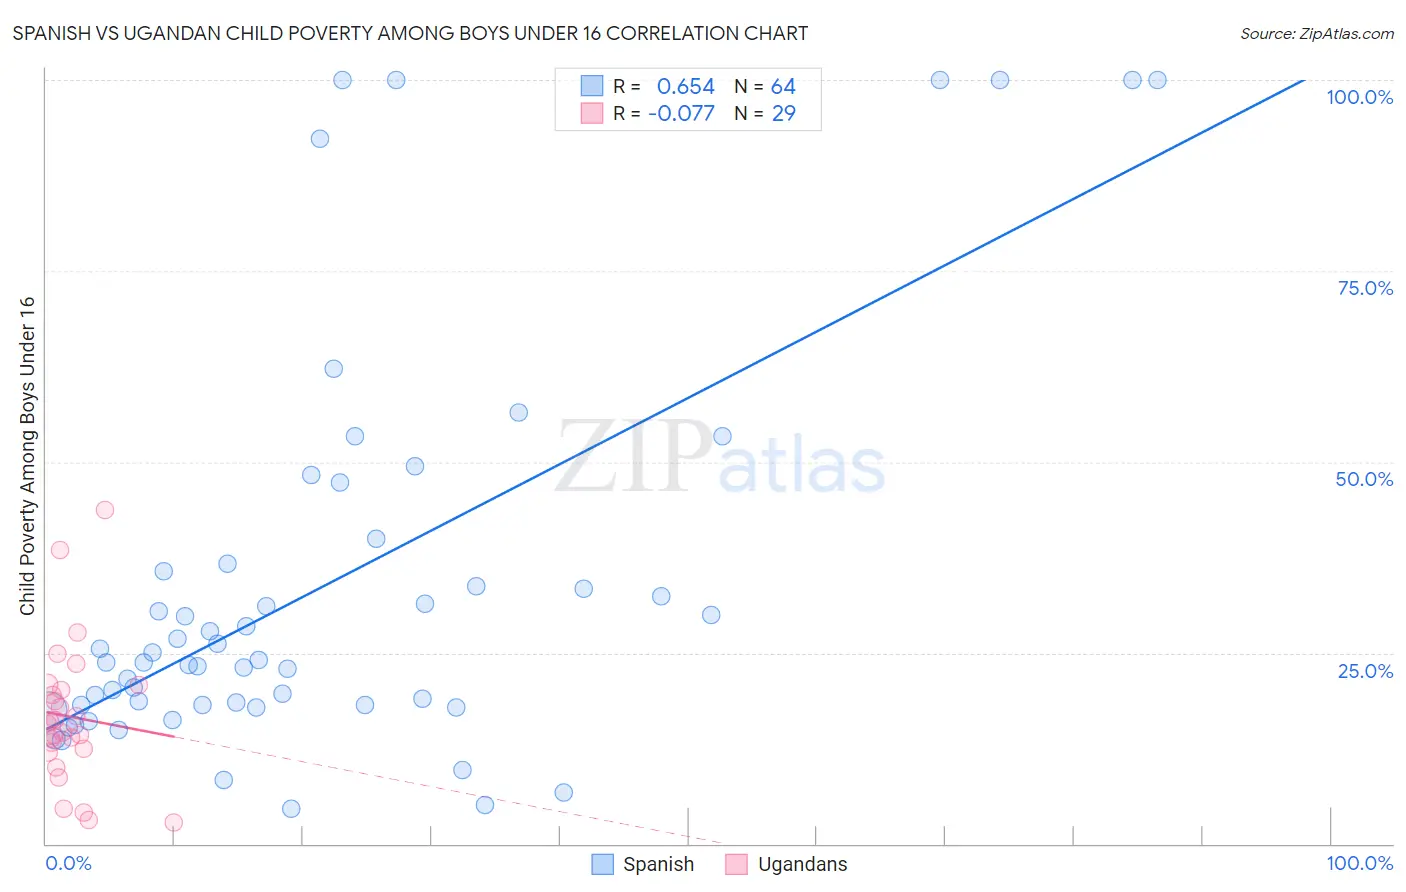
Spanish vs Ugandan Child Poverty Among Boys Under 16 Correlation Chart
The statistical analysis conducted on geographies consisting of 415,463,522 people shows a significant positive correlation between the proportion of Spanish and poverty level among boys under the age of 16 in the United States with a correlation coefficient (R) of 0.654 and weighted average of 17.0%. Similarly, the statistical analysis conducted on geographies consisting of 93,708,162 people shows a slight negative correlation between the proportion of Ugandans and poverty level among boys under the age of 16 in the United States with a correlation coefficient (R) of -0.077 and weighted average of 17.3%, a difference of 1.6%.
Child Poverty Among Boys Under 16 Correlation Summary
| Measurement | Spanish | Ugandan |
| Minimum | 4.6% | 2.8% |
| Maximum | 100.0% | 43.7% |
| Range | 95.4% | 41.0% |
| Mean | 33.7% | 16.6% |
| Median | 23.9% | 15.8% |
| Interquartile 25% (IQ1) | 18.2% | 12.2% |
| Interquartile 75% (IQ3) | 36.2% | 20.5% |
| Interquartile Range (IQR) | 18.0% | 8.3% |
| Standard Deviation (Sample) | 26.1% | 9.2% |
| Standard Deviation (Population) | 25.9% | 9.1% |
Demographics Similar to Spanish and Ugandans by Child Poverty Among Boys Under 16
In terms of child poverty among boys under 16, the demographic groups most similar to Spanish are Spaniard (17.1%, a difference of 0.040%), Immigrants from Lebanon (17.0%, a difference of 0.070%), Immigrants from Kenya (17.1%, a difference of 0.11%), Immigrants from Uganda (17.0%, a difference of 0.14%), and Immigrants from Iraq (17.0%, a difference of 0.14%). Similarly, the demographic groups most similar to Ugandans are Immigrants from Uzbekistan (17.3%, a difference of 0.20%), Immigrants from Sierra Leone (17.3%, a difference of 0.22%), Immigrants from Afghanistan (17.3%, a difference of 0.28%), Immigrants from Portugal (17.4%, a difference of 0.33%), and German Russian (17.4%, a difference of 0.39%).
| Demographics | Rating | Rank | Child Poverty Among Boys Under 16 |
| Immigrants | Morocco | 34.5 /100 | #189 | Fair 16.7% |
| Arabs | 31.1 /100 | #190 | Fair 16.8% |
| Alaska Natives | 29.8 /100 | #191 | Fair 16.8% |
| Immigrants | Uganda | 21.6 /100 | #192 | Fair 17.0% |
| Immigrants | Iraq | 21.6 /100 | #193 | Fair 17.0% |
| Immigrants | Lebanon | 21.2 /100 | #194 | Fair 17.0% |
| Spanish | 20.8 /100 | #195 | Fair 17.0% |
| Spaniards | 20.5 /100 | #196 | Fair 17.1% |
| Immigrants | Kenya | 20.1 /100 | #197 | Fair 17.1% |
| Immigrants | Cameroon | 19.0 /100 | #198 | Poor 17.1% |
| Delaware | 18.8 /100 | #199 | Poor 17.1% |
| Immigrants | Uruguay | 16.9 /100 | #200 | Poor 17.2% |
| Immigrants | Afghanistan | 13.7 /100 | #201 | Poor 17.3% |
| Immigrants | Sierra Leone | 13.4 /100 | #202 | Poor 17.3% |
| Immigrants | Uzbekistan | 13.3 /100 | #203 | Poor 17.3% |
| Ugandans | 12.5 /100 | #204 | Poor 17.3% |
| Immigrants | Portugal | 11.2 /100 | #205 | Poor 17.4% |
| German Russians | 10.9 /100 | #206 | Poor 17.4% |
| Immigrants | Thailand | 8.2 /100 | #207 | Tragic 17.5% |
| Malaysians | 7.6 /100 | #208 | Tragic 17.6% |
| Alaskan Athabascans | 7.3 /100 | #209 | Tragic 17.6% |