Spanish vs Immigrants from Asia Child Poverty Among Girls Under 16
COMPARE
Spanish
Immigrants from Asia
Child Poverty Among Girls Under 16
Child Poverty Among Girls Under 16 Comparison
Spanish
Immigrants from Asia
16.9%
CHILD POVERTY AMONG GIRLS UNDER 16
28.6/ 100
METRIC RATING
194th/ 347
METRIC RANK
14.1%
CHILD POVERTY AMONG GIRLS UNDER 16
99.4/ 100
METRIC RATING
44th/ 347
METRIC RANK
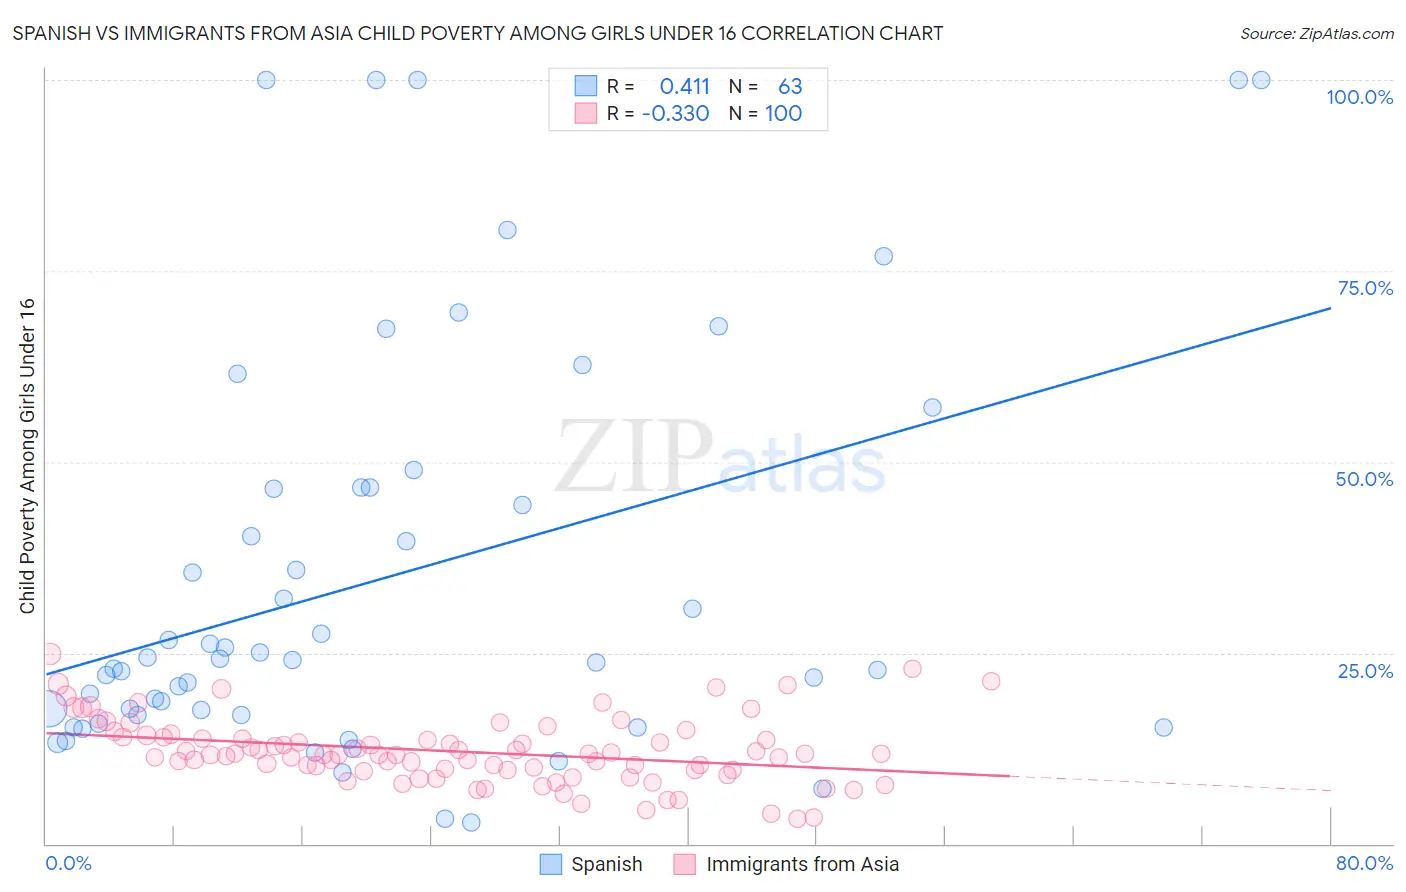
Spanish vs Immigrants from Asia Child Poverty Among Girls Under 16 Correlation Chart
The statistical analysis conducted on geographies consisting of 414,340,286 people shows a moderate positive correlation between the proportion of Spanish and poverty level among girls under the age of 16 in the United States with a correlation coefficient (R) of 0.411 and weighted average of 16.9%. Similarly, the statistical analysis conducted on geographies consisting of 530,744,277 people shows a mild negative correlation between the proportion of Immigrants from Asia and poverty level among girls under the age of 16 in the United States with a correlation coefficient (R) of -0.330 and weighted average of 14.1%, a difference of 20.1%.
Child Poverty Among Girls Under 16 Correlation Summary
| Measurement | Spanish | Immigrants from Asia |
| Minimum | 2.9% | 3.3% |
| Maximum | 100.0% | 24.9% |
| Range | 97.1% | 21.6% |
| Mean | 34.8% | 12.1% |
| Median | 24.1% | 11.6% |
| Interquartile 25% (IQ1) | 16.8% | 9.6% |
| Interquartile 75% (IQ3) | 46.7% | 14.0% |
| Interquartile Range (IQR) | 29.9% | 4.3% |
| Standard Deviation (Sample) | 26.6% | 4.3% |
| Standard Deviation (Population) | 26.4% | 4.3% |
Similar Demographics by Child Poverty Among Girls Under 16
Demographics Similar to Spanish by Child Poverty Among Girls Under 16
In terms of child poverty among girls under 16, the demographic groups most similar to Spanish are Aleut (16.9%, a difference of 0.010%), Immigrants from Uganda (16.8%, a difference of 0.36%), Immigrants from the Azores (16.8%, a difference of 0.37%), Immigrants from Costa Rica (17.0%, a difference of 0.43%), and Celtic (17.0%, a difference of 0.48%).
| Demographics | Rating | Rank | Child Poverty Among Girls Under 16 |
| Immigrants | Morocco | 34.6 /100 | #187 | Fair 16.8% |
| Arabs | 34.5 /100 | #188 | Fair 16.8% |
| Immigrants | Bosnia and Herzegovina | 32.5 /100 | #189 | Fair 16.8% |
| Kenyans | 32.3 /100 | #190 | Fair 16.8% |
| Immigrants | Azores | 31.3 /100 | #191 | Fair 16.8% |
| Immigrants | Uganda | 31.3 /100 | #192 | Fair 16.8% |
| Aleuts | 28.7 /100 | #193 | Fair 16.9% |
| Spanish | 28.6 /100 | #194 | Fair 16.9% |
| Immigrants | Costa Rica | 25.6 /100 | #195 | Fair 17.0% |
| Celtics | 25.2 /100 | #196 | Fair 17.0% |
| Spaniards | 24.9 /100 | #197 | Fair 17.0% |
| Immigrants | Lebanon | 22.6 /100 | #198 | Fair 17.1% |
| Immigrants | Afghanistan | 22.4 /100 | #199 | Fair 17.1% |
| Immigrants | Uzbekistan | 21.5 /100 | #200 | Fair 17.1% |
| Immigrants | Kenya | 17.8 /100 | #201 | Poor 17.2% |
Demographics Similar to Immigrants from Asia by Child Poverty Among Girls Under 16
In terms of child poverty among girls under 16, the demographic groups most similar to Immigrants from Asia are Korean (14.1%, a difference of 0.14%), Immigrants from Scotland (14.0%, a difference of 0.29%), Immigrants from Sri Lanka (14.0%, a difference of 0.45%), Immigrants from Bolivia (14.0%, a difference of 0.45%), and Immigrants from Greece (14.1%, a difference of 0.51%).
| Demographics | Rating | Rank | Child Poverty Among Girls Under 16 |
| Lithuanians | 99.6 /100 | #37 | Exceptional 13.9% |
| Immigrants | Moldova | 99.6 /100 | #38 | Exceptional 13.9% |
| Immigrants | Australia | 99.5 /100 | #39 | Exceptional 14.0% |
| Immigrants | Sri Lanka | 99.5 /100 | #40 | Exceptional 14.0% |
| Immigrants | Bolivia | 99.5 /100 | #41 | Exceptional 14.0% |
| Immigrants | Scotland | 99.4 /100 | #42 | Exceptional 14.0% |
| Koreans | 99.4 /100 | #43 | Exceptional 14.1% |
| Immigrants | Asia | 99.4 /100 | #44 | Exceptional 14.1% |
| Immigrants | Greece | 99.3 /100 | #45 | Exceptional 14.1% |
| Croatians | 99.3 /100 | #46 | Exceptional 14.1% |
| Immigrants | Czechoslovakia | 99.3 /100 | #47 | Exceptional 14.2% |
| Czechs | 99.3 /100 | #48 | Exceptional 14.2% |
| Greeks | 99.2 /100 | #49 | Exceptional 14.2% |
| Immigrants | Israel | 99.2 /100 | #50 | Exceptional 14.2% |
| Immigrants | Pakistan | 99.1 /100 | #51 | Exceptional 14.2% |