Spanish vs Fijian Child Poverty Under the Age of 16
COMPARE
Spanish
Fijian
Child Poverty Under the Age of 16
Child Poverty Under the Age of 16 Comparison
Spanish
Fijians
16.7%
CHILD POVERTY UNDER THE AGE OF 16
24.5/ 100
METRIC RATING
192nd/ 347
METRIC RANK
18.4%
CHILD POVERTY UNDER THE AGE OF 16
1.1/ 100
METRIC RATING
233rd/ 347
METRIC RANK
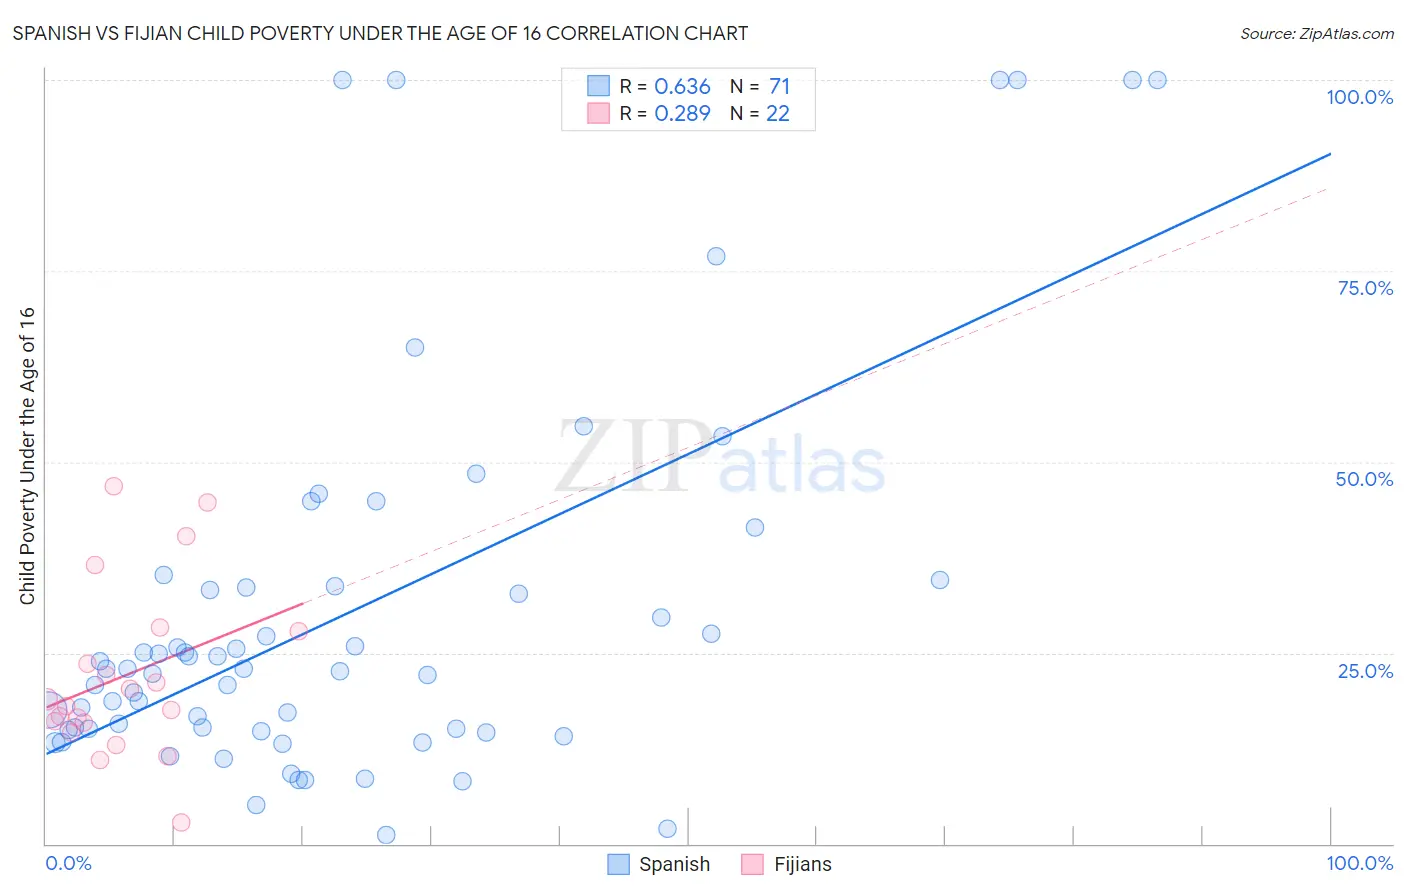
Spanish vs Fijian Child Poverty Under the Age of 16 Correlation Chart
The statistical analysis conducted on geographies consisting of 418,352,698 people shows a significant positive correlation between the proportion of Spanish and poverty level among children under the age of 16 in the United States with a correlation coefficient (R) of 0.636 and weighted average of 16.7%. Similarly, the statistical analysis conducted on geographies consisting of 55,914,100 people shows a weak positive correlation between the proportion of Fijians and poverty level among children under the age of 16 in the United States with a correlation coefficient (R) of 0.289 and weighted average of 18.4%, a difference of 9.7%.
Child Poverty Under the Age of 16 Correlation Summary
| Measurement | Spanish | Fijian |
| Minimum | 1.1% | 2.8% |
| Maximum | 100.0% | 46.8% |
| Range | 98.9% | 43.9% |
| Mean | 30.3% | 22.0% |
| Median | 22.9% | 18.5% |
| Interquartile 25% (IQ1) | 14.9% | 15.9% |
| Interquartile 75% (IQ3) | 33.7% | 27.9% |
| Interquartile Range (IQR) | 18.8% | 12.0% |
| Standard Deviation (Sample) | 25.5% | 11.3% |
| Standard Deviation (Population) | 25.3% | 11.0% |
Similar Demographics by Child Poverty Under the Age of 16
Demographics Similar to Spanish by Child Poverty Under the Age of 16
In terms of child poverty under the age of 16, the demographic groups most similar to Spanish are Spaniard (16.8%, a difference of 0.20%), Immigrants from Uruguay (16.8%, a difference of 0.22%), Immigrants from Uganda (16.8%, a difference of 0.31%), Immigrants from Lebanon (16.8%, a difference of 0.39%), and Immigrants from Iraq (16.7%, a difference of 0.57%).
| Demographics | Rating | Rank | Child Poverty Under the Age of 16 |
| Immigrants | Bosnia and Herzegovina | 37.4 /100 | #185 | Fair 16.5% |
| Kenyans | 34.1 /100 | #186 | Fair 16.5% |
| Arabs | 31.4 /100 | #187 | Fair 16.6% |
| Immigrants | Morocco | 31.2 /100 | #188 | Fair 16.6% |
| Immigrants | Portugal | 30.0 /100 | #189 | Fair 16.6% |
| Immigrants | Costa Rica | 29.6 /100 | #190 | Fair 16.6% |
| Immigrants | Iraq | 28.3 /100 | #191 | Fair 16.7% |
| Spanish | 24.5 /100 | #192 | Fair 16.7% |
| Spaniards | 23.2 /100 | #193 | Fair 16.8% |
| Immigrants | Uruguay | 23.1 /100 | #194 | Fair 16.8% |
| Immigrants | Uganda | 22.5 /100 | #195 | Fair 16.8% |
| Immigrants | Lebanon | 22.0 /100 | #196 | Fair 16.8% |
| Immigrants | Kenya | 19.1 /100 | #197 | Poor 16.9% |
| Delaware | 17.1 /100 | #198 | Poor 17.0% |
| Immigrants | Afghanistan | 15.1 /100 | #199 | Poor 17.0% |
Demographics Similar to Fijians by Child Poverty Under the Age of 16
In terms of child poverty under the age of 16, the demographic groups most similar to Fijians are American (18.3%, a difference of 0.22%), Immigrants from Nigeria (18.4%, a difference of 0.25%), Nigerian (18.4%, a difference of 0.31%), Cree (18.5%, a difference of 0.60%), and Sudanese (18.5%, a difference of 0.63%).
| Demographics | Rating | Rank | Child Poverty Under the Age of 16 |
| Bermudans | 2.6 /100 | #226 | Tragic 18.0% |
| Immigrants | Africa | 2.5 /100 | #227 | Tragic 18.0% |
| Immigrants | Micronesia | 2.3 /100 | #228 | Tragic 18.0% |
| Marshallese | 1.8 /100 | #229 | Tragic 18.1% |
| Nepalese | 1.7 /100 | #230 | Tragic 18.2% |
| Nicaraguans | 1.7 /100 | #231 | Tragic 18.2% |
| Americans | 1.2 /100 | #232 | Tragic 18.3% |
| Fijians | 1.1 /100 | #233 | Tragic 18.4% |
| Immigrants | Nigeria | 1.0 /100 | #234 | Tragic 18.4% |
| Nigerians | 1.0 /100 | #235 | Tragic 18.4% |
| Cree | 0.9 /100 | #236 | Tragic 18.5% |
| Sudanese | 0.9 /100 | #237 | Tragic 18.5% |
| Immigrants | Eritrea | 0.8 /100 | #238 | Tragic 18.5% |
| Immigrants | Sudan | 0.8 /100 | #239 | Tragic 18.5% |
| Ghanaians | 0.8 /100 | #240 | Tragic 18.6% |