Spanish vs British West Indian Child Poverty Under the Age of 5
COMPARE
Spanish
British West Indian
Child Poverty Under the Age of 5
Child Poverty Under the Age of 5 Comparison
Spanish
British West Indians
18.2%
CHILD POVERTY UNDER THE AGE OF 5
9.8/ 100
METRIC RATING
209th/ 347
METRIC RANK
21.4%
CHILD POVERTY UNDER THE AGE OF 5
0.0/ 100
METRIC RATING
291st/ 347
METRIC RANK
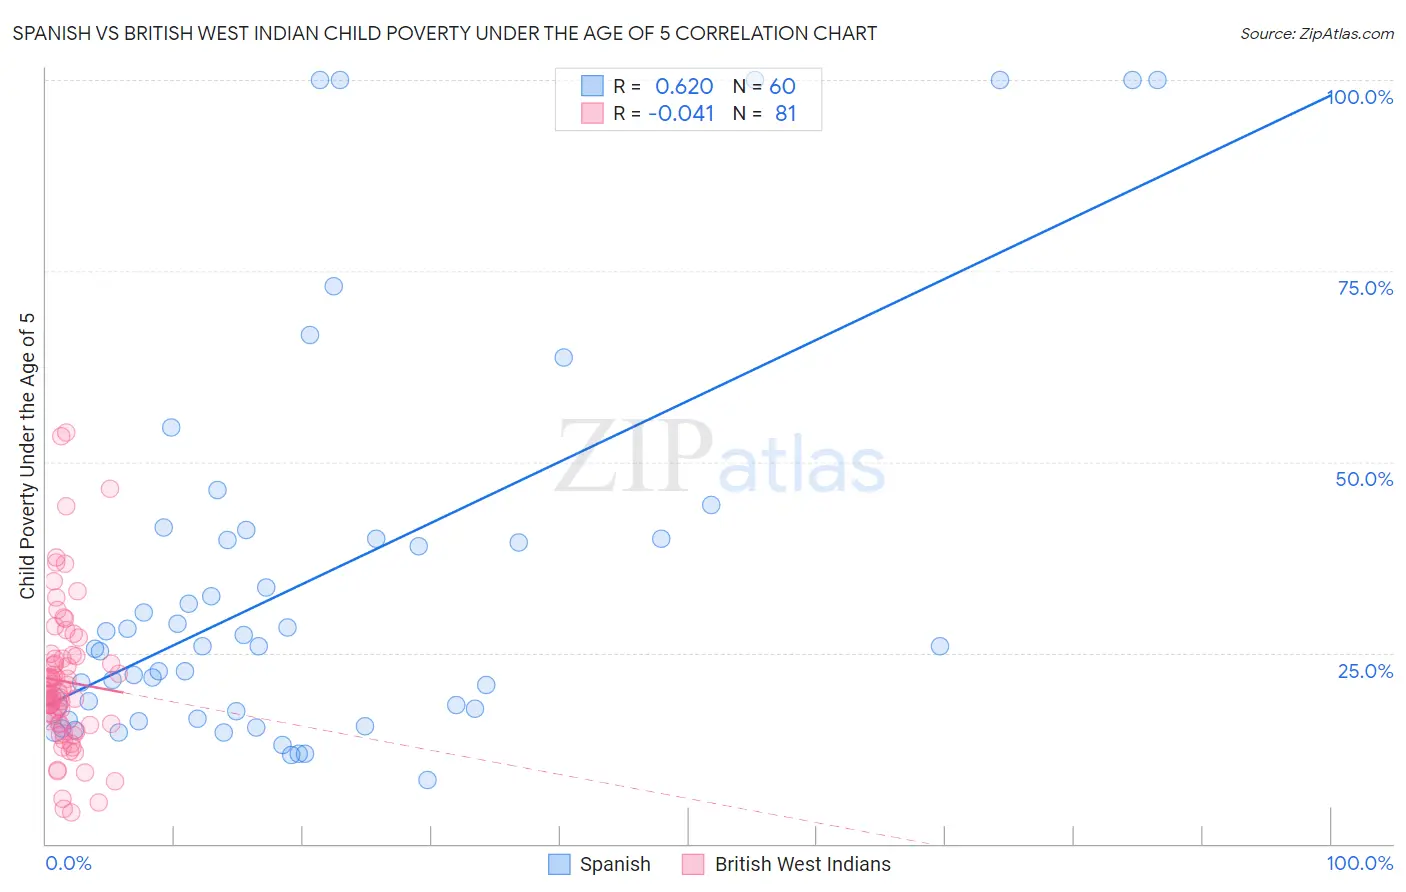
Spanish vs British West Indian Child Poverty Under the Age of 5 Correlation Chart
The statistical analysis conducted on geographies consisting of 404,966,909 people shows a significant positive correlation between the proportion of Spanish and poverty level among children under the age of 5 in the United States with a correlation coefficient (R) of 0.620 and weighted average of 18.2%. Similarly, the statistical analysis conducted on geographies consisting of 150,575,514 people shows no correlation between the proportion of British West Indians and poverty level among children under the age of 5 in the United States with a correlation coefficient (R) of -0.041 and weighted average of 21.4%, a difference of 17.6%.
Child Poverty Under the Age of 5 Correlation Summary
| Measurement | Spanish | British West Indian |
| Minimum | 8.4% | 4.1% |
| Maximum | 100.0% | 53.9% |
| Range | 91.6% | 49.8% |
| Mean | 34.6% | 21.2% |
| Median | 25.9% | 19.5% |
| Interquartile 25% (IQ1) | 16.9% | 15.7% |
| Interquartile 75% (IQ3) | 40.0% | 24.4% |
| Interquartile Range (IQR) | 23.1% | 8.7% |
| Standard Deviation (Sample) | 25.9% | 9.7% |
| Standard Deviation (Population) | 25.6% | 9.6% |
Similar Demographics by Child Poverty Under the Age of 5
Demographics Similar to Spanish by Child Poverty Under the Age of 5
In terms of child poverty under the age of 5, the demographic groups most similar to Spanish are Scotch-Irish (18.2%, a difference of 0.010%), Panamanian (18.2%, a difference of 0.010%), Immigrants (18.2%, a difference of 0.020%), Moroccan (18.2%, a difference of 0.10%), and Nepalese (18.3%, a difference of 0.31%).
| Demographics | Rating | Rank | Child Poverty Under the Age of 5 |
| Japanese | 13.8 /100 | #202 | Poor 18.1% |
| Immigrants | Cambodia | 13.7 /100 | #203 | Poor 18.1% |
| Immigrants | Eastern Africa | 13.4 /100 | #204 | Poor 18.1% |
| Spaniards | 12.8 /100 | #205 | Poor 18.1% |
| Whites/Caucasians | 12.6 /100 | #206 | Poor 18.1% |
| Immigrants | Immigrants | 9.9 /100 | #207 | Tragic 18.2% |
| Scotch-Irish | 9.8 /100 | #208 | Tragic 18.2% |
| Spanish | 9.8 /100 | #209 | Tragic 18.2% |
| Panamanians | 9.7 /100 | #210 | Tragic 18.2% |
| Moroccans | 9.4 /100 | #211 | Tragic 18.2% |
| Nepalese | 8.7 /100 | #212 | Tragic 18.3% |
| Immigrants | Thailand | 8.6 /100 | #213 | Tragic 18.3% |
| Malaysians | 6.5 /100 | #214 | Tragic 18.4% |
| Immigrants | Panama | 6.0 /100 | #215 | Tragic 18.5% |
| Hmong | 5.0 /100 | #216 | Tragic 18.5% |
Demographics Similar to British West Indians by Child Poverty Under the Age of 5
In terms of child poverty under the age of 5, the demographic groups most similar to British West Indians are Immigrants from Caribbean (21.4%, a difference of 0.17%), Immigrants from Haiti (21.3%, a difference of 0.58%), Immigrants from Somalia (21.6%, a difference of 0.60%), Immigrants from Senegal (21.3%, a difference of 0.65%), and Immigrants from Zaire (21.3%, a difference of 0.82%).
| Demographics | Rating | Rank | Child Poverty Under the Age of 5 |
| Somalis | 0.0 /100 | #284 | Tragic 21.1% |
| Haitians | 0.0 /100 | #285 | Tragic 21.2% |
| Immigrants | Latin America | 0.0 /100 | #286 | Tragic 21.2% |
| Immigrants | Zaire | 0.0 /100 | #287 | Tragic 21.3% |
| Immigrants | Senegal | 0.0 /100 | #288 | Tragic 21.3% |
| Immigrants | Haiti | 0.0 /100 | #289 | Tragic 21.3% |
| Immigrants | Caribbean | 0.0 /100 | #290 | Tragic 21.4% |
| British West Indians | 0.0 /100 | #291 | Tragic 21.4% |
| Immigrants | Somalia | 0.0 /100 | #292 | Tragic 21.6% |
| Mexicans | 0.0 /100 | #293 | Tragic 21.6% |
| Guatemalans | 0.0 /100 | #294 | Tragic 21.6% |
| Cherokee | 0.0 /100 | #295 | Tragic 21.7% |
| Yaqui | 0.0 /100 | #296 | Tragic 21.7% |
| Hispanics or Latinos | 0.0 /100 | #297 | Tragic 21.7% |
| Blackfeet | 0.0 /100 | #298 | Tragic 21.8% |