Spanish American vs Immigrants from Ethiopia Poverty
COMPARE
Spanish American
Immigrants from Ethiopia
Poverty
Poverty Comparison
Spanish Americans
Immigrants from Ethiopia
14.7%
POVERTY
0.0/ 100
METRIC RATING
273rd/ 347
METRIC RANK
12.2%
POVERTY
58.6/ 100
METRIC RATING
163rd/ 347
METRIC RANK
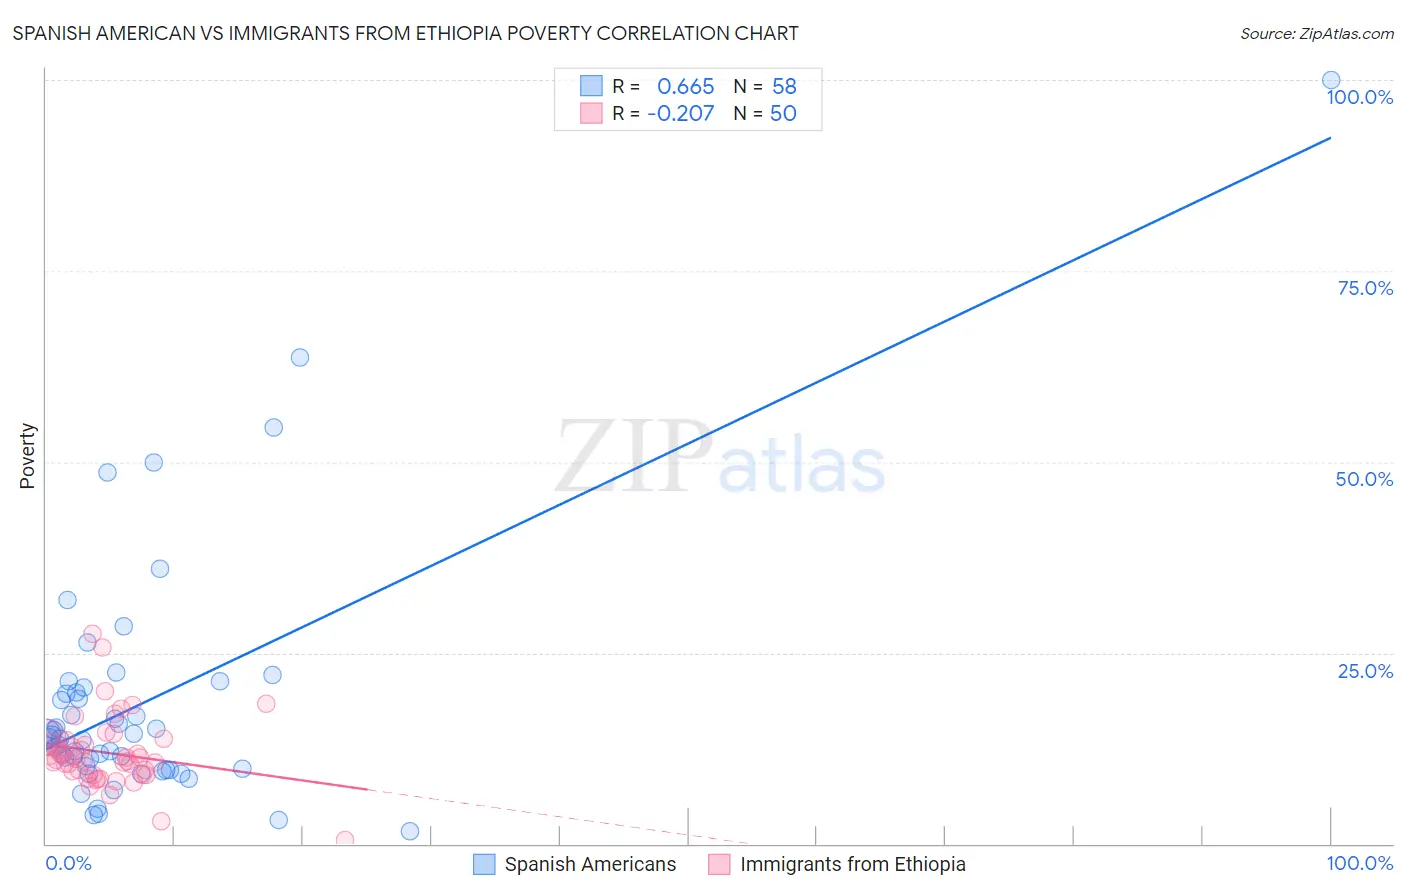
Spanish American vs Immigrants from Ethiopia Poverty Correlation Chart
The statistical analysis conducted on geographies consisting of 103,164,738 people shows a significant positive correlation between the proportion of Spanish Americans and poverty level in the United States with a correlation coefficient (R) of 0.665 and weighted average of 14.7%. Similarly, the statistical analysis conducted on geographies consisting of 211,460,176 people shows a weak negative correlation between the proportion of Immigrants from Ethiopia and poverty level in the United States with a correlation coefficient (R) of -0.207 and weighted average of 12.2%, a difference of 20.7%.
Poverty Correlation Summary
| Measurement | Spanish American | Immigrants from Ethiopia |
| Minimum | 1.6% | 0.57% |
| Maximum | 100.0% | 27.5% |
| Range | 98.4% | 26.9% |
| Mean | 18.4% | 11.9% |
| Median | 13.8% | 11.0% |
| Interquartile 25% (IQ1) | 9.8% | 9.0% |
| Interquartile 75% (IQ3) | 19.8% | 13.6% |
| Interquartile Range (IQR) | 10.0% | 4.6% |
| Standard Deviation (Sample) | 16.4% | 4.7% |
| Standard Deviation (Population) | 16.3% | 4.6% |
Similar Demographics by Poverty
Demographics Similar to Spanish Americans by Poverty
In terms of poverty, the demographic groups most similar to Spanish Americans are Barbadian (14.8%, a difference of 0.39%), Immigrants from West Indies (14.8%, a difference of 0.43%), Immigrants from Bahamas (14.8%, a difference of 0.43%), Bangladeshi (14.8%, a difference of 0.48%), and Belizean (14.8%, a difference of 0.50%).
| Demographics | Rating | Rank | Poverty |
| Guyanese | 0.1 /100 | #266 | Tragic 14.5% |
| Iroquois | 0.1 /100 | #267 | Tragic 14.5% |
| Sub-Saharan Africans | 0.1 /100 | #268 | Tragic 14.5% |
| Immigrants | Cuba | 0.1 /100 | #269 | Tragic 14.6% |
| Central Americans | 0.1 /100 | #270 | Tragic 14.6% |
| Shoshone | 0.0 /100 | #271 | Tragic 14.7% |
| Chickasaw | 0.0 /100 | #272 | Tragic 14.7% |
| Spanish Americans | 0.0 /100 | #273 | Tragic 14.7% |
| Barbadians | 0.0 /100 | #274 | Tragic 14.8% |
| Immigrants | West Indies | 0.0 /100 | #275 | Tragic 14.8% |
| Immigrants | Bahamas | 0.0 /100 | #276 | Tragic 14.8% |
| Bangladeshis | 0.0 /100 | #277 | Tragic 14.8% |
| Belizeans | 0.0 /100 | #278 | Tragic 14.8% |
| Immigrants | St. Vincent and the Grenadines | 0.0 /100 | #279 | Tragic 14.9% |
| Haitians | 0.0 /100 | #280 | Tragic 14.9% |
Demographics Similar to Immigrants from Ethiopia by Poverty
In terms of poverty, the demographic groups most similar to Immigrants from Ethiopia are Ethiopian (12.2%, a difference of 0.050%), Immigrants from Fiji (12.2%, a difference of 0.060%), Colombian (12.2%, a difference of 0.070%), Immigrants from Albania (12.2%, a difference of 0.080%), and Venezuelan (12.2%, a difference of 0.17%).
| Demographics | Rating | Rank | Poverty |
| Scotch-Irish | 62.6 /100 | #156 | Good 12.2% |
| Costa Ricans | 62.2 /100 | #157 | Good 12.2% |
| Taiwanese | 61.8 /100 | #158 | Good 12.2% |
| Pennsylvania Germans | 60.8 /100 | #159 | Good 12.2% |
| Immigrants | Nepal | 60.4 /100 | #160 | Good 12.2% |
| Immigrants | Fiji | 59.1 /100 | #161 | Average 12.2% |
| Ethiopians | 59.1 /100 | #162 | Average 12.2% |
| Immigrants | Ethiopia | 58.6 /100 | #163 | Average 12.2% |
| Colombians | 57.8 /100 | #164 | Average 12.2% |
| Immigrants | Albania | 57.7 /100 | #165 | Average 12.2% |
| Venezuelans | 56.9 /100 | #166 | Average 12.2% |
| Immigrants | Chile | 56.7 /100 | #167 | Average 12.2% |
| Immigrants | Venezuela | 56.5 /100 | #168 | Average 12.2% |
| Whites/Caucasians | 55.4 /100 | #169 | Average 12.3% |
| Immigrants | Oceania | 54.6 /100 | #170 | Average 12.3% |