Spanish American vs American Single Mother Poverty
COMPARE
Spanish American
American
Single Mother Poverty
Single Mother Poverty Comparison
Spanish Americans
Americans
32.3%
SINGLE MOTHER POVERTY
0.0/ 100
METRIC RATING
283rd/ 347
METRIC RANK
33.5%
SINGLE MOTHER POVERTY
0.0/ 100
METRIC RATING
303rd/ 347
METRIC RANK
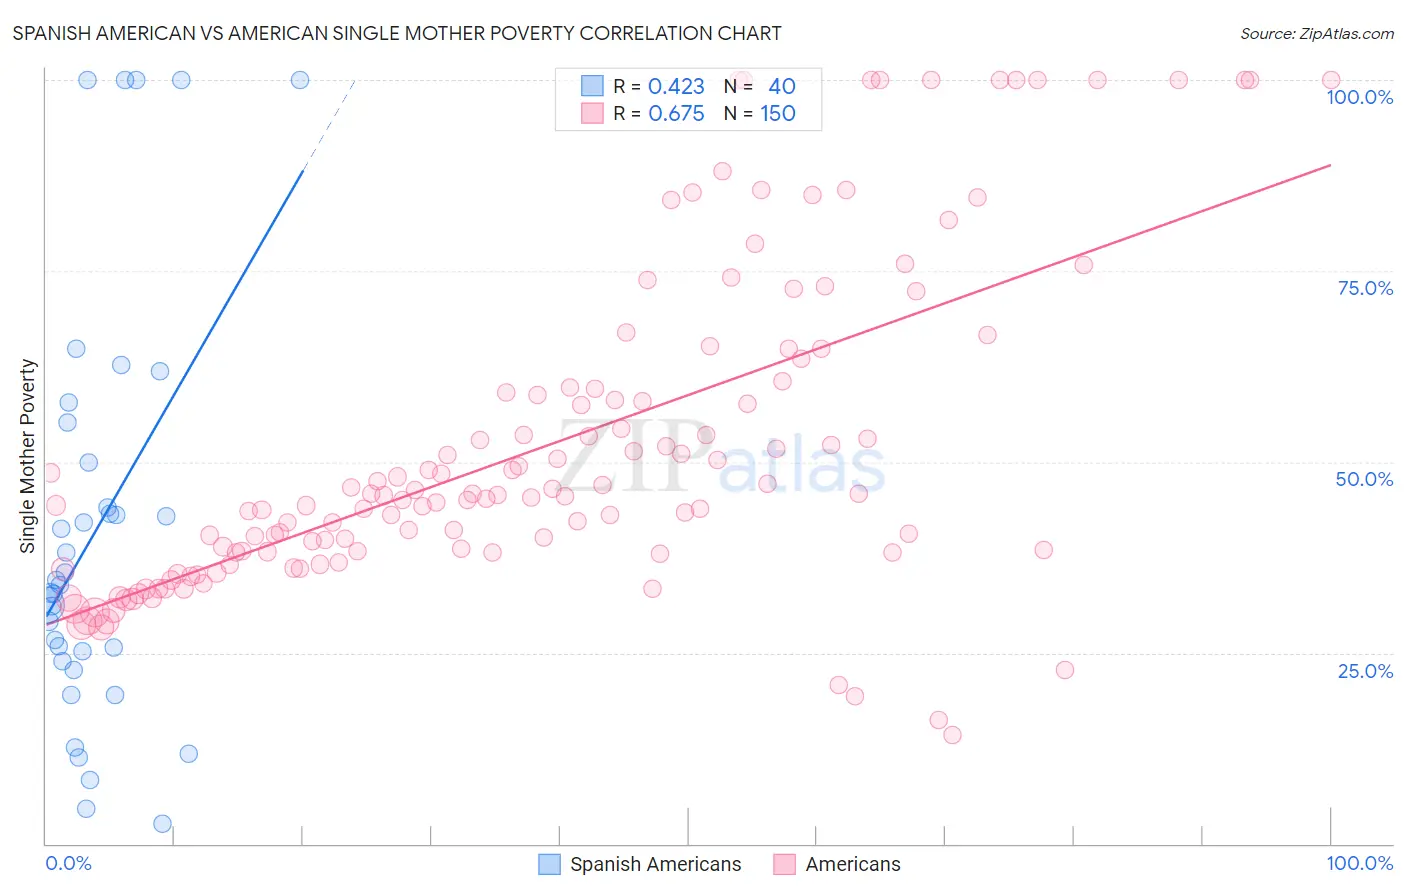
Spanish American vs American Single Mother Poverty Correlation Chart
The statistical analysis conducted on geographies consisting of 102,717,575 people shows a moderate positive correlation between the proportion of Spanish Americans and poverty level among single mothers in the United States with a correlation coefficient (R) of 0.423 and weighted average of 32.3%. Similarly, the statistical analysis conducted on geographies consisting of 551,658,648 people shows a significant positive correlation between the proportion of Americans and poverty level among single mothers in the United States with a correlation coefficient (R) of 0.675 and weighted average of 33.5%, a difference of 3.8%.
Single Mother Poverty Correlation Summary
| Measurement | Spanish American | American |
| Minimum | 2.6% | 14.3% |
| Maximum | 100.0% | 100.0% |
| Range | 97.4% | 85.7% |
| Mean | 41.2% | 51.9% |
| Median | 34.2% | 45.5% |
| Interquartile 25% (IQ1) | 24.5% | 38.2% |
| Interquartile 75% (IQ3) | 52.6% | 59.6% |
| Interquartile Range (IQR) | 28.0% | 21.5% |
| Standard Deviation (Sample) | 27.2% | 21.0% |
| Standard Deviation (Population) | 26.9% | 20.9% |
Demographics Similar to Spanish Americans and Americans by Single Mother Poverty
In terms of single mother poverty, the demographic groups most similar to Spanish Americans are Indonesian (32.4%, a difference of 0.30%), Immigrants from Latin America (32.4%, a difference of 0.41%), Yup'ik (32.5%, a difference of 0.48%), Immigrants from Dominica (32.5%, a difference of 0.61%), and Somali (32.6%, a difference of 0.84%). Similarly, the demographic groups most similar to Americans are Arapaho (33.4%, a difference of 0.26%), Immigrants from Somalia (33.4%, a difference of 0.41%), Immigrants from Guatemala (33.3%, a difference of 0.65%), Hispanic or Latino (33.3%, a difference of 0.65%), and African (33.3%, a difference of 0.74%).
| Demographics | Rating | Rank | Single Mother Poverty |
| Spanish Americans | 0.0 /100 | #283 | Tragic 32.3% |
| Indonesians | 0.0 /100 | #284 | Tragic 32.4% |
| Immigrants | Latin America | 0.0 /100 | #285 | Tragic 32.4% |
| Yup'ik | 0.0 /100 | #286 | Tragic 32.5% |
| Immigrants | Dominica | 0.0 /100 | #287 | Tragic 32.5% |
| Somalis | 0.0 /100 | #288 | Tragic 32.6% |
| U.S. Virgin Islanders | 0.0 /100 | #289 | Tragic 32.6% |
| Osage | 0.0 /100 | #290 | Tragic 32.6% |
| Guatemalans | 0.0 /100 | #291 | Tragic 32.9% |
| Shoshone | 0.0 /100 | #292 | Tragic 32.9% |
| Aleuts | 0.0 /100 | #293 | Tragic 32.9% |
| French American Indians | 0.0 /100 | #294 | Tragic 33.1% |
| Yaqui | 0.0 /100 | #295 | Tragic 33.1% |
| Blackfeet | 0.0 /100 | #296 | Tragic 33.2% |
| Pennsylvania Germans | 0.0 /100 | #297 | Tragic 33.2% |
| Africans | 0.0 /100 | #298 | Tragic 33.3% |
| Immigrants | Guatemala | 0.0 /100 | #299 | Tragic 33.3% |
| Hispanics or Latinos | 0.0 /100 | #300 | Tragic 33.3% |
| Immigrants | Somalia | 0.0 /100 | #301 | Tragic 33.4% |
| Arapaho | 0.0 /100 | #302 | Tragic 33.4% |
| Americans | 0.0 /100 | #303 | Tragic 33.5% |