Spanish American Indian vs New Zealander Female Poverty Among 25-34 Year Olds
COMPARE
Spanish American Indian
New Zealander
Female Poverty Among 25-34 Year Olds
Female Poverty Among 25-34 Year Olds Comparison
Spanish American Indians
New Zealanders
14.3%
FEMALE POVERTY AMONG 25-34 YEAR OLDS
5.5/ 100
METRIC RATING
217th/ 347
METRIC RANK
13.1%
FEMALE POVERTY AMONG 25-34 YEAR OLDS
83.4/ 100
METRIC RATING
141st/ 347
METRIC RANK
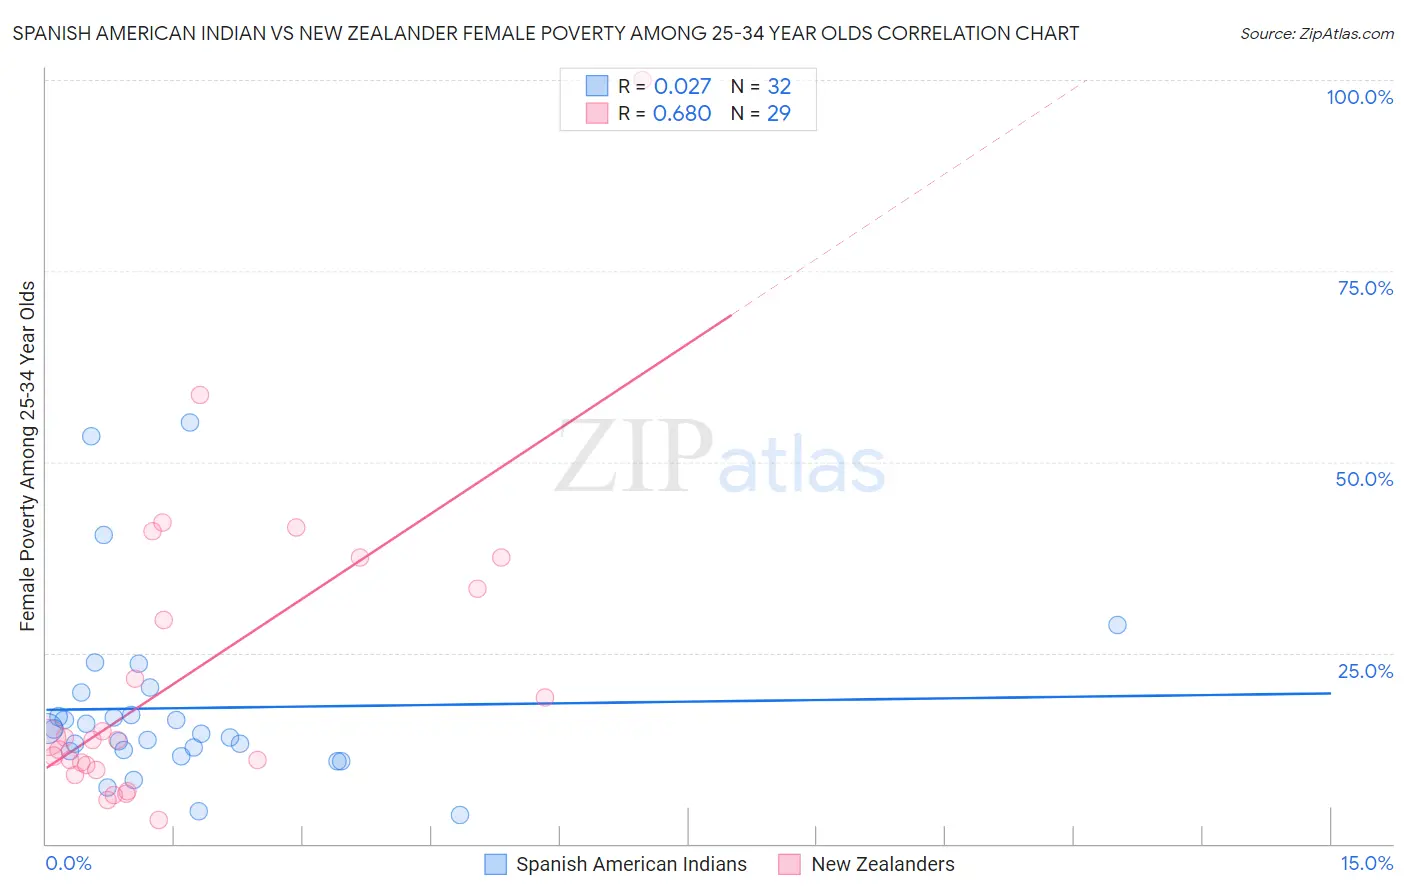
Spanish American Indian vs New Zealander Female Poverty Among 25-34 Year Olds Correlation Chart
The statistical analysis conducted on geographies consisting of 73,082,371 people shows no correlation between the proportion of Spanish American Indians and poverty level among females between the ages 25 and 34 in the United States with a correlation coefficient (R) of 0.027 and weighted average of 14.3%. Similarly, the statistical analysis conducted on geographies consisting of 106,217,230 people shows a significant positive correlation between the proportion of New Zealanders and poverty level among females between the ages 25 and 34 in the United States with a correlation coefficient (R) of 0.680 and weighted average of 13.1%, a difference of 9.6%.
Female Poverty Among 25-34 Year Olds Correlation Summary
| Measurement | Spanish American Indian | New Zealander |
| Minimum | 3.8% | 3.1% |
| Maximum | 55.2% | 100.0% |
| Range | 51.5% | 96.9% |
| Mean | 17.8% | 22.2% |
| Median | 14.7% | 13.6% |
| Interquartile 25% (IQ1) | 12.2% | 10.0% |
| Interquartile 75% (IQ3) | 18.4% | 35.4% |
| Interquartile Range (IQR) | 6.2% | 25.4% |
| Standard Deviation (Sample) | 11.8% | 20.6% |
| Standard Deviation (Population) | 11.6% | 20.3% |
Similar Demographics by Female Poverty Among 25-34 Year Olds
Demographics Similar to Spanish American Indians by Female Poverty Among 25-34 Year Olds
In terms of female poverty among 25-34 year olds, the demographic groups most similar to Spanish American Indians are French Canadian (14.3%, a difference of 0.0%), Immigrants from Thailand (14.3%, a difference of 0.11%), Ecuadorian (14.3%, a difference of 0.11%), Immigrants from Nigeria (14.3%, a difference of 0.25%), and French (14.3%, a difference of 0.27%).
| Demographics | Rating | Rank | Female Poverty Among 25-34 Year Olds |
| Panamanians | 8.6 /100 | #210 | Tragic 14.2% |
| Trinidadians and Tobagonians | 8.2 /100 | #211 | Tragic 14.2% |
| Immigrants | Guyana | 6.6 /100 | #212 | Tragic 14.3% |
| Puget Sound Salish | 6.5 /100 | #213 | Tragic 14.3% |
| French | 6.2 /100 | #214 | Tragic 14.3% |
| Immigrants | Nigeria | 6.2 /100 | #215 | Tragic 14.3% |
| French Canadians | 5.5 /100 | #216 | Tragic 14.3% |
| Spanish American Indians | 5.5 /100 | #217 | Tragic 14.3% |
| Immigrants | Thailand | 5.2 /100 | #218 | Tragic 14.3% |
| Ecuadorians | 5.2 /100 | #219 | Tragic 14.3% |
| Ghanaians | 4.8 /100 | #220 | Tragic 14.4% |
| Sudanese | 4.4 /100 | #221 | Tragic 14.4% |
| Immigrants | Portugal | 4.3 /100 | #222 | Tragic 14.4% |
| Nigerians | 4.2 /100 | #223 | Tragic 14.4% |
| Immigrants | Sudan | 4.0 /100 | #224 | Tragic 14.4% |
Demographics Similar to New Zealanders by Female Poverty Among 25-34 Year Olds
In terms of female poverty among 25-34 year olds, the demographic groups most similar to New Zealanders are Immigrants from Iraq (13.1%, a difference of 0.040%), Austrian (13.1%, a difference of 0.060%), Scandinavian (13.1%, a difference of 0.16%), Brazilian (13.1%, a difference of 0.18%), and Immigrants from Chile (13.1%, a difference of 0.20%).
| Demographics | Rating | Rank | Female Poverty Among 25-34 Year Olds |
| Afghans | 85.8 /100 | #134 | Excellent 13.0% |
| South Africans | 85.7 /100 | #135 | Excellent 13.0% |
| Immigrants | England | 85.5 /100 | #136 | Excellent 13.0% |
| Immigrants | Chile | 84.6 /100 | #137 | Excellent 13.1% |
| Brazilians | 84.5 /100 | #138 | Excellent 13.1% |
| Austrians | 83.7 /100 | #139 | Excellent 13.1% |
| Immigrants | Iraq | 83.6 /100 | #140 | Excellent 13.1% |
| New Zealanders | 83.4 /100 | #141 | Excellent 13.1% |
| Scandinavians | 82.3 /100 | #142 | Excellent 13.1% |
| Israelis | 81.9 /100 | #143 | Excellent 13.1% |
| Native Hawaiians | 78.9 /100 | #144 | Good 13.2% |
| Colombians | 77.2 /100 | #145 | Good 13.2% |
| South Americans | 76.9 /100 | #146 | Good 13.2% |
| Europeans | 76.8 /100 | #147 | Good 13.2% |
| Lebanese | 76.8 /100 | #148 | Good 13.2% |