Spaniard vs Korean Child Poverty Under the Age of 5

COMPARE

Spaniard
Race
Ancestry
AfghanAfricanAlaska NativeAlaskan AthabascanAlbanianAleutAlsatianAmericanApacheArabArapahoArgentineanArmenianAssyrian/Chaldean/SyriacAustralianAustrianBahamianBangladeshiBarbadianBasqueBelgianBelizeanBermudanBhutaneseBlackfeetBolivianBrazilianBritishBritish West IndianBulgarianBurmeseCajunCambodianCanadianCape VerdeanCarpatho RusynCelticCentral AmericanCentral American IndianCherokeeCheyenneChickasawChileanChineseChippewaChoctawColombianColvilleComancheCosta RicanCreeCreekCroatianCrowCubanCypriotCzechCzechoslovakianDanishDelawareDominicanDutchDutch West IndianEastern EuropeanEcuadorianEgyptianEnglishEstonianEthiopianEuropeanFijianFilipinoFinnishFrenchFrench American IndianFrench CanadianGermanGerman RussianGhanaianGreekGuamanian/ChamorroGuatemalanGuyaneseHaitianHmongHonduranHopiHoumaHungarianIcelanderIndian (Asian)IndonesianInupiatIranianIraqiIrishIroquoisIsraeliItalianJamaicanJapaneseJordanianKenyanKiowaLaotianLatvianLebaneseLiberianLithuanianLumbeeLuxembourgerMacedonianMalaysianMalteseMarshalleseMenomineeMexicanMexican American IndianMongolianMoroccanNative HawaiianNavajoNepaleseNew ZealanderNicaraguanNigerianNorthern EuropeanNorwegianOkinawanOsageOttawaPaiutePakistaniPalestinianPanamanianParaguayanPennsylvania GermanPeruvianPimaPolishPortuguesePotawatomiPuebloPuerto RicanPuget Sound SalishRomanianRussianSalvadoranSamoanScandinavianScotch-IrishScottishSeminoleSenegaleseSerbianShoshoneSierra LeoneanSiouxSlavicSlovakSloveneSomaliSouth AfricanSouth AmericanSouth American IndianSoviet UnionSpaniardSpanishSpanish AmericanSpanish American IndianSri LankanSubsaharan AfricanSudaneseSwedishSwissSyrianTaiwaneseThaiTlingit-HaidaTohono O'OdhamTonganTrinidadian and TobagonianTsimshianTurkishU.S. Virgin IslanderUgandanUkrainianUruguayanUteVenezuelanVietnameseWelshWest IndianYakamaYaquiYugoslavianYumanYup'ikZimbabwean
Immigration
NonimmigrantsImmigrantsAfghanistanAfricaAlbaniaArgentinaArmeniaAsiaAustraliaAustriaBahamasBangladeshBarbadosBelarusBelgiumBelizeBoliviaBosnia and HerzegovinaBrazilBulgariaBurma/MyanmarCabo VerdeCambodiaCameroonCanadaCaribbeanCentral AmericaChileChinaColombiaCongoCosta RicaCroatiaCubaCzechoslovakiaDenmarkDominicaDominican RepublicEastern AfricaEastern AsiaEastern EuropeEcuadorEgyptEl SalvadorEnglandEritreaEthiopiaEuropeFijiFranceGermanyGhanaGreeceGrenadaGuatemalaGuyanaHaitiHondurasHong KongHungaryIndiaIndonesiaIranIraqIrelandIsraelItalyJamaicaJapanJordanKazakhstanKenyaKoreaKuwaitLaosLatin AmericaLatviaLebanonLiberiaLithuaniaMalaysiaMexicoMicronesiaMiddle AfricaMoldovaMoroccoNepalNetherlandsNicaraguaNigeriaNorth AmericaNorth MacedoniaNorthern AfricaNorthern EuropeNorwayOceaniaPakistanPanamaPeruPhilippinesPolandPortugalRomaniaRussiaSaudi ArabiaScotlandSenegalSerbiaSierra LeoneSingaporeSomaliaSouth AfricaSouth AmericaSouth Central AsiaSouth Eastern AsiaSouthern EuropeSpainSri LankaSt. Vincent and the GrenadinesSudanSwedenSwitzerlandSyriaTaiwanThailandTrinidad and TobagoTurkeyUgandaUkraineUruguayUzbekistanVenezuelaVietnamWest IndiesWestern AfricaWestern AsiaWestern EuropeYemenZaireZimbabweAzores
Korean
Race
Ancestry
AfghanAfricanAlaska NativeAlaskan AthabascanAlbanianAleutAlsatianAmericanApacheArabArapahoArgentineanArmenianAssyrian/Chaldean/SyriacAustralianAustrianBahamianBangladeshiBarbadianBasqueBelgianBelizeanBermudanBhutaneseBlackfeetBolivianBrazilianBritishBritish West IndianBulgarianBurmeseCajunCambodianCanadianCape VerdeanCarpatho RusynCelticCentral AmericanCentral American IndianCherokeeCheyenneChickasawChileanChineseChippewaChoctawColombianColvilleComancheCosta RicanCreeCreekCroatianCrowCubanCypriotCzechCzechoslovakianDanishDelawareDominicanDutchDutch West IndianEastern EuropeanEcuadorianEgyptianEnglishEstonianEthiopianEuropeanFijianFilipinoFinnishFrenchFrench American IndianFrench CanadianGermanGerman RussianGhanaianGreekGuamanian/ChamorroGuatemalanGuyaneseHaitianHmongHonduranHopiHoumaHungarianIcelanderIndian (Asian)IndonesianInupiatIranianIraqiIrishIroquoisIsraeliItalianJamaicanJapaneseJordanianKenyanKiowaKoreanLaotianLatvianLebaneseLiberianLithuanianLumbeeLuxembourgerMacedonianMalaysianMalteseMarshalleseMenomineeMexicanMexican American IndianMongolianMoroccanNative HawaiianNavajoNepaleseNew ZealanderNicaraguanNigerianNorthern EuropeanNorwegianOkinawanOsageOttawaPaiutePakistaniPalestinianPanamanianParaguayanPennsylvania GermanPeruvianPimaPolishPortuguesePotawatomiPuebloPuerto RicanPuget Sound SalishRomanianRussianSalvadoranSamoanScandinavianScotch-IrishScottishSeminoleSenegaleseSerbianShoshoneSierra LeoneanSiouxSlavicSlovakSloveneSomaliSouth AfricanSouth AmericanSouth American IndianSoviet UnionSpanishSpanish AmericanSpanish American IndianSri LankanSubsaharan AfricanSudaneseSwedishSwissSyrianTaiwaneseThaiTlingit-HaidaTohono O'OdhamTonganTrinidadian and TobagonianTsimshianTurkishU.S. Virgin IslanderUgandanUkrainianUruguayanUteVenezuelanVietnameseWelshWest IndianYakamaYaquiYugoslavianYumanYup'ikZimbabwean
Immigration
NonimmigrantsImmigrantsAfghanistanAfricaAlbaniaArgentinaArmeniaAsiaAustraliaAustriaBahamasBangladeshBarbadosBelarusBelgiumBelizeBoliviaBosnia and HerzegovinaBrazilBulgariaBurma/MyanmarCabo VerdeCambodiaCameroonCanadaCaribbeanCentral AmericaChileChinaColombiaCongoCosta RicaCroatiaCubaCzechoslovakiaDenmarkDominicaDominican RepublicEastern AfricaEastern AsiaEastern EuropeEcuadorEgyptEl SalvadorEnglandEritreaEthiopiaEuropeFijiFranceGermanyGhanaGreeceGrenadaGuatemalaGuyanaHaitiHondurasHong KongHungaryIndiaIndonesiaIranIraqIrelandIsraelItalyJamaicaJapanJordanKazakhstanKenyaKoreaKuwaitLaosLatin AmericaLatviaLebanonLiberiaLithuaniaMalaysiaMexicoMicronesiaMiddle AfricaMoldovaMoroccoNepalNetherlandsNicaraguaNigeriaNorth AmericaNorth MacedoniaNorthern AfricaNorthern EuropeNorwayOceaniaPakistanPanamaPeruPhilippinesPolandPortugalRomaniaRussiaSaudi ArabiaScotlandSenegalSerbiaSierra LeoneSingaporeSomaliaSouth AfricaSouth AmericaSouth Central AsiaSouth Eastern AsiaSouthern EuropeSpainSri LankaSt. Vincent and the GrenadinesSudanSwedenSwitzerlandSyriaTaiwanThailandTrinidad and TobagoTurkeyUgandaUkraineUruguayUzbekistanVenezuelaVietnamWest IndiesWestern AfricaWestern AsiaWestern EuropeYemenZaireZimbabweAzores
Child Poverty Under the Age of 5
Income
Poverty
Unemployment
Labor Participation
Family Structure
Vehicle Availability
Education Level
Disability

Child Poverty Under the Age of 5 Comparison

Spaniards

Koreans

Poor
Exceptional
18.1%
CHILD POVERTY UNDER THE AGE OF 5
12.8/ 100
METRIC RATING
205th/ 347
METRIC RANK
14.4%
CHILD POVERTY UNDER THE AGE OF 5
99.8/ 100
METRIC RATING
31st/ 347
METRIC RANK

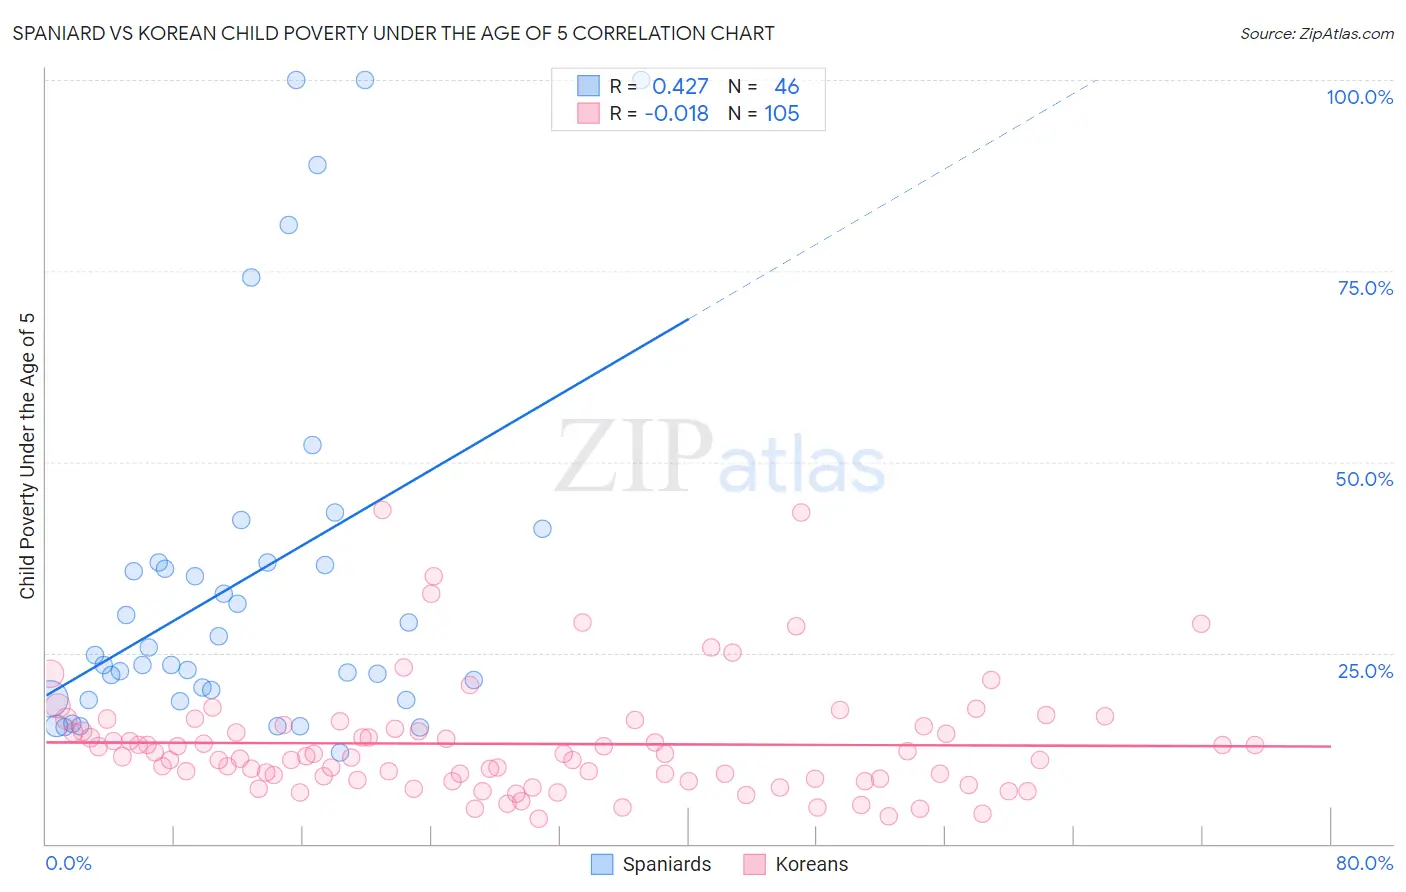
Spaniard vs Korean Child Poverty Under the Age of 5 Correlation Chart

The statistical analysis conducted on geographies consisting of 424,376,046 people shows a moderate positive correlation between the proportion of Spaniards and poverty level among children under the age of 5 in the United States with a correlation coefficient (R) of 0.427 and weighted average of 18.1%. Similarly, the statistical analysis conducted on geographies consisting of 483,948,585 people shows no correlation between the proportion of Koreans and poverty level among children under the age of 5 in the United States with a correlation coefficient (R) of -0.018 and weighted average of 14.4%, a difference of 25.6%.
Spaniard vs Korean Child Poverty Under the Age of 5

Child Poverty Under the Age of 5 Correlation Summary

MeasurementSpaniardKorean
Minimum11.9%3.3%
Maximum100.0%43.8%
Range88.1%40.5%
Mean34.4%13.1%
Median24.1%11.4%
Interquartile 25% (IQ1)19.0%8.5%
Interquartile 75% (IQ3)36.8%15.2%
Interquartile Range (IQR)17.7%6.7%
Standard Deviation (Sample)24.1%7.5%
Standard Deviation (Population)23.8%7.5%

Similar Demographics by Child Poverty Under the Age of 5

Demographics Similar to Spaniards by Child Poverty Under the Age of 5

In terms of child poverty under the age of 5, the demographic groups most similar to Spaniards are White/Caucasian (18.1%, a difference of 0.060%), Immigrants from Eastern Africa (18.1%, a difference of 0.13%), Immigrants from Cambodia (18.1%, a difference of 0.19%), Japanese (18.1%, a difference of 0.21%), and Ugandan (18.0%, a difference of 0.22%).
DemographicsRating | RankChild Poverty Under the Age of 5
Celtics
18.3
/100
|
#198
Poor
17.9%
Hungarians
18.3
/100
|
#199
Poor
17.9%
Iraqis
14.0
/100
|
#200
Poor
18.0%
Ugandans
13.9
/100
|
#201
Poor
18.0%
Japanese
13.8
/100
|
#202
Poor
18.1%
Immigrants | Cambodia
13.7
/100
|
#203
Poor
18.1%
Immigrants | Eastern Africa
13.4
/100
|
#204
Poor
18.1%
Spaniards
12.8
/100
|
#205
Poor
18.1%
Whites/Caucasians
12.6
/100
|
#206
Poor
18.1%
Immigrants | Immigrants
9.9
/100
|
#207
Tragic
18.2%
Scotch-Irish
9.8
/100
|
#208
Tragic
18.2%
Spanish
9.8
/100
|
#209
Tragic
18.2%
Panamanians
9.7
/100
|
#210
Tragic
18.2%
Moroccans
9.4
/100
|
#211
Tragic
18.2%
Nepalese
8.7
/100
|
#212
Tragic
18.3%

Demographics Similar to Koreans by Child Poverty Under the Age of 5

In terms of child poverty under the age of 5, the demographic groups most similar to Koreans are Cambodian (14.4%, a difference of 0.030%), Immigrants from Asia (14.4%, a difference of 0.080%), Immigrants from Sri Lanka (14.4%, a difference of 0.28%), Immigrants from Indonesia (14.3%, a difference of 0.47%), and Taiwanese (14.5%, a difference of 0.58%).
DemographicsRating | RankChild Poverty Under the Age of 5
Asians
99.9
/100
|
#24
Exceptional
14.0%
Cypriots
99.9
/100
|
#25
Exceptional
14.0%
Immigrants | Lithuania
99.9
/100
|
#26
Exceptional
14.1%
Tongans
99.9
/100
|
#27
Exceptional
14.2%
Immigrants | Indonesia
99.8
/100
|
#28
Exceptional
14.3%
Immigrants | Asia
99.8
/100
|
#29
Exceptional
14.4%
Cambodians
99.8
/100
|
#30
Exceptional
14.4%
Koreans
99.8
/100
|
#31
Exceptional
14.4%
Immigrants | Sri Lanka
99.8
/100
|
#32
Exceptional
14.4%
Taiwanese
99.8
/100
|
#33
Exceptional
14.5%
Immigrants | Moldova
99.8
/100
|
#34
Exceptional
14.5%
Latvians
99.8
/100
|
#35
Exceptional
14.5%
Maltese
99.8
/100
|
#36
Exceptional
14.5%
Turks
99.7
/100
|
#37
Exceptional
14.6%
Eastern Europeans
99.7
/100
|
#38
Exceptional
14.6%