Soviet Union vs Slavic Female Poverty Among 25-34 Year Olds
COMPARE
Soviet Union
Slavic
Female Poverty Among 25-34 Year Olds
Female Poverty Among 25-34 Year Olds Comparison
Soviet Union
Slavs
12.1%
FEMALE POVERTY AMONG 25-34 YEAR OLDS
99.3/ 100
METRIC RATING
63rd/ 347
METRIC RANK
13.2%
FEMALE POVERTY AMONG 25-34 YEAR OLDS
75.7/ 100
METRIC RATING
152nd/ 347
METRIC RANK
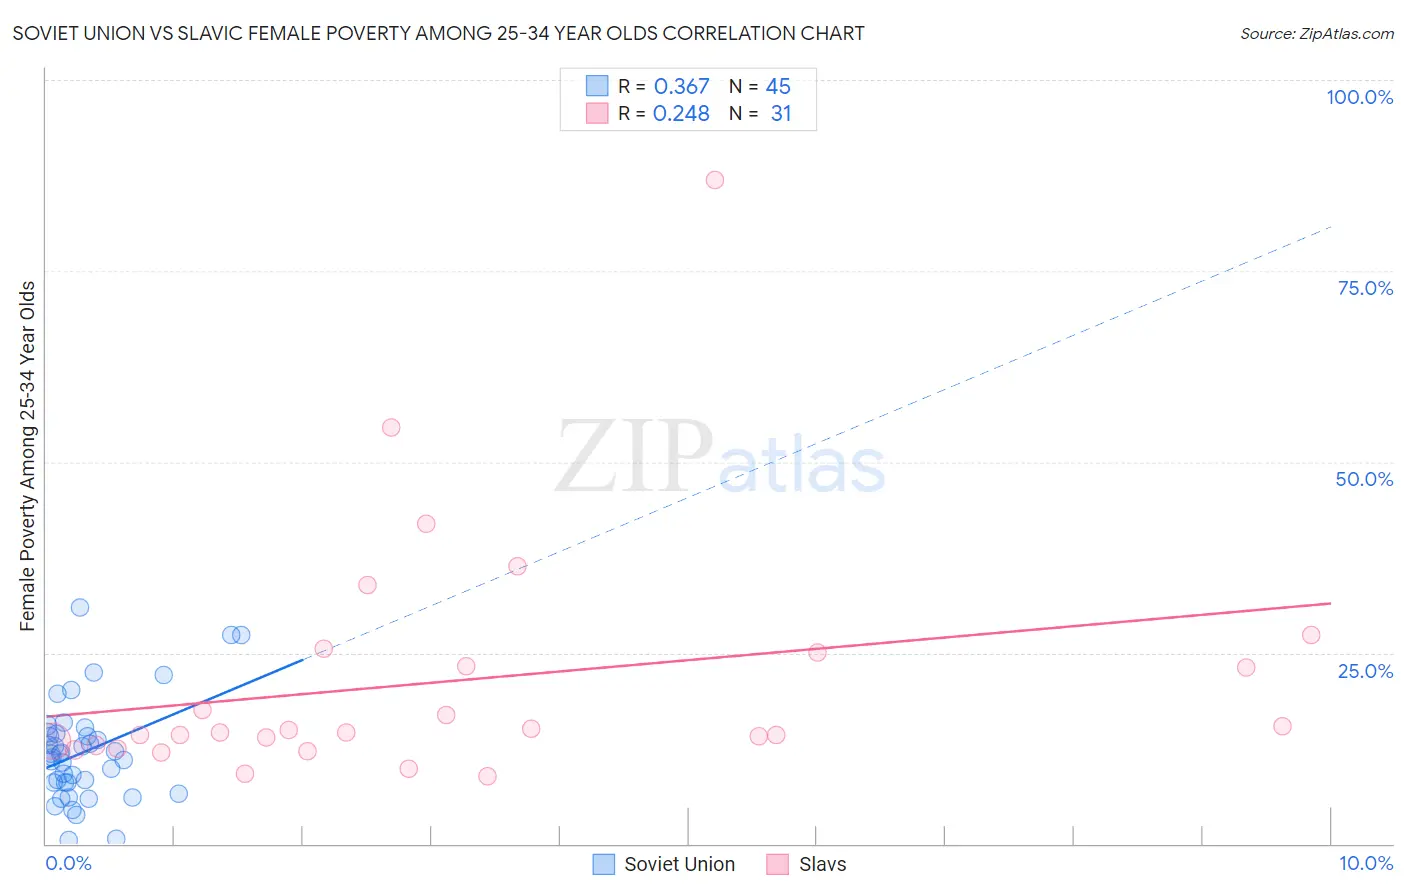
Soviet Union vs Slavic Female Poverty Among 25-34 Year Olds Correlation Chart
The statistical analysis conducted on geographies consisting of 43,444,949 people shows a mild positive correlation between the proportion of Soviet Union and poverty level among females between the ages 25 and 34 in the United States with a correlation coefficient (R) of 0.367 and weighted average of 12.1%. Similarly, the statistical analysis conducted on geographies consisting of 266,820,007 people shows a weak positive correlation between the proportion of Slavs and poverty level among females between the ages 25 and 34 in the United States with a correlation coefficient (R) of 0.248 and weighted average of 13.2%, a difference of 8.9%.
Female Poverty Among 25-34 Year Olds Correlation Summary
| Measurement | Soviet Union | Slavic |
| Minimum | 0.43% | 8.9% |
| Maximum | 31.0% | 87.0% |
| Range | 30.5% | 78.1% |
| Mean | 12.1% | 21.3% |
| Median | 11.8% | 14.5% |
| Interquartile 25% (IQ1) | 8.0% | 12.9% |
| Interquartile 75% (IQ3) | 14.5% | 25.0% |
| Interquartile Range (IQR) | 6.5% | 12.1% |
| Standard Deviation (Sample) | 6.6% | 16.0% |
| Standard Deviation (Population) | 6.6% | 15.8% |
Similar Demographics by Female Poverty Among 25-34 Year Olds
Demographics Similar to Soviet Union by Female Poverty Among 25-34 Year Olds
In terms of female poverty among 25-34 year olds, the demographic groups most similar to Soviet Union are Immigrants from Moldova (12.1%, a difference of 0.010%), Immigrants from Czechoslovakia (12.1%, a difference of 0.18%), Immigrants from Northern Europe (12.1%, a difference of 0.21%), Immigrants from Russia (12.2%, a difference of 0.24%), and Armenian (12.2%, a difference of 0.25%).
| Demographics | Rating | Rank | Female Poverty Among 25-34 Year Olds |
| Luxembourgers | 99.5 /100 | #56 | Exceptional 12.1% |
| Jordanians | 99.4 /100 | #57 | Exceptional 12.1% |
| Immigrants | Romania | 99.4 /100 | #58 | Exceptional 12.1% |
| Russians | 99.4 /100 | #59 | Exceptional 12.1% |
| Immigrants | Northern Europe | 99.4 /100 | #60 | Exceptional 12.1% |
| Immigrants | Czechoslovakia | 99.4 /100 | #61 | Exceptional 12.1% |
| Immigrants | Moldova | 99.3 /100 | #62 | Exceptional 12.1% |
| Soviet Union | 99.3 /100 | #63 | Exceptional 12.1% |
| Immigrants | Russia | 99.2 /100 | #64 | Exceptional 12.2% |
| Armenians | 99.2 /100 | #65 | Exceptional 12.2% |
| Immigrants | Europe | 99.2 /100 | #66 | Exceptional 12.2% |
| Laotians | 99.2 /100 | #67 | Exceptional 12.2% |
| Sri Lankans | 99.1 /100 | #68 | Exceptional 12.2% |
| Immigrants | Lebanon | 99.1 /100 | #69 | Exceptional 12.2% |
| Immigrants | Belgium | 99.1 /100 | #70 | Exceptional 12.2% |
Demographics Similar to Slavs by Female Poverty Among 25-34 Year Olds
In terms of female poverty among 25-34 year olds, the demographic groups most similar to Slavs are Costa Rican (13.2%, a difference of 0.010%), Iraqi (13.2%, a difference of 0.040%), Sierra Leonean (13.2%, a difference of 0.060%), European (13.2%, a difference of 0.13%), and Lebanese (13.2%, a difference of 0.13%).
| Demographics | Rating | Rank | Female Poverty Among 25-34 Year Olds |
| Colombians | 77.2 /100 | #145 | Good 13.2% |
| South Americans | 76.9 /100 | #146 | Good 13.2% |
| Europeans | 76.8 /100 | #147 | Good 13.2% |
| Lebanese | 76.8 /100 | #148 | Good 13.2% |
| Sierra Leoneans | 76.3 /100 | #149 | Good 13.2% |
| Iraqis | 76.0 /100 | #150 | Good 13.2% |
| Costa Ricans | 75.8 /100 | #151 | Good 13.2% |
| Slavs | 75.7 /100 | #152 | Good 13.2% |
| Northern Europeans | 73.7 /100 | #153 | Good 13.2% |
| Arabs | 73.5 /100 | #154 | Good 13.2% |
| Immigrants | Sierra Leone | 72.9 /100 | #155 | Good 13.3% |
| Immigrants | Cameroon | 72.0 /100 | #156 | Good 13.3% |
| Immigrants | Western Europe | 70.3 /100 | #157 | Good 13.3% |
| Immigrants | Colombia | 69.2 /100 | #158 | Good 13.3% |
| Uruguayans | 66.9 /100 | #159 | Good 13.3% |