Soviet Union vs Immigrants from Jamaica Male Poverty
COMPARE
Soviet Union
Immigrants from Jamaica
Male Poverty
Male Poverty Comparison
Soviet Union
Immigrants from Jamaica
11.1%
MALE POVERTY
60.3/ 100
METRIC RATING
160th/ 347
METRIC RANK
13.3%
MALE POVERTY
0.1/ 100
METRIC RATING
267th/ 347
METRIC RANK
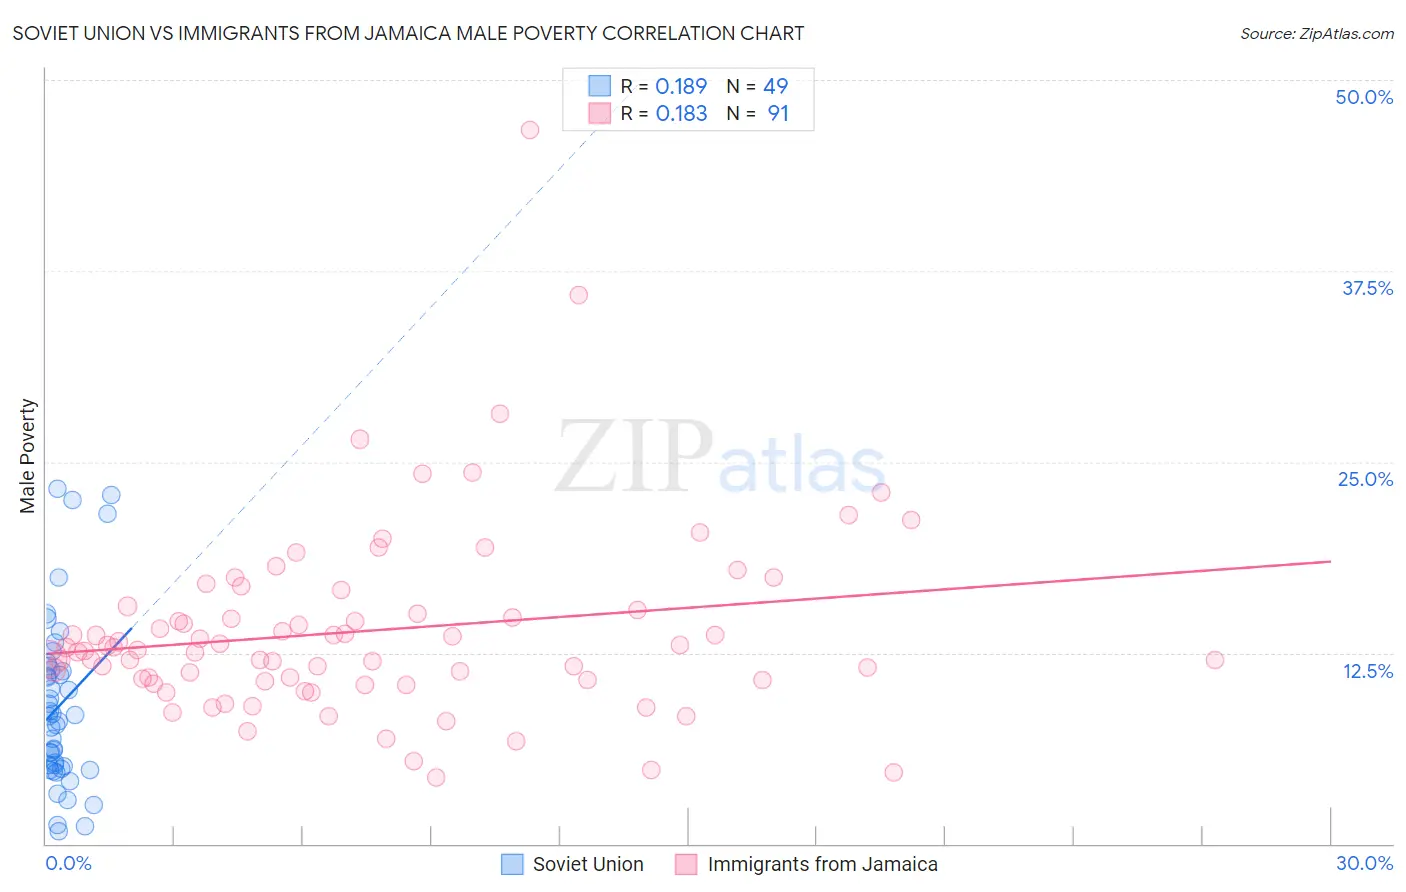
Soviet Union vs Immigrants from Jamaica Male Poverty Correlation Chart
The statistical analysis conducted on geographies consisting of 43,503,005 people shows a poor positive correlation between the proportion of Soviet Union and poverty level among males in the United States with a correlation coefficient (R) of 0.189 and weighted average of 11.1%. Similarly, the statistical analysis conducted on geographies consisting of 301,555,462 people shows a poor positive correlation between the proportion of Immigrants from Jamaica and poverty level among males in the United States with a correlation coefficient (R) of 0.183 and weighted average of 13.3%, a difference of 19.7%.
Male Poverty Correlation Summary
| Measurement | Soviet Union | Immigrants from Jamaica |
| Minimum | 0.80% | 4.3% |
| Maximum | 23.2% | 46.7% |
| Range | 22.4% | 42.4% |
| Mean | 9.1% | 13.9% |
| Median | 8.4% | 12.7% |
| Interquartile 25% (IQ1) | 5.0% | 10.7% |
| Interquartile 75% (IQ3) | 11.5% | 15.3% |
| Interquartile Range (IQR) | 6.4% | 4.6% |
| Standard Deviation (Sample) | 5.6% | 6.2% |
| Standard Deviation (Population) | 5.5% | 6.2% |
Similar Demographics by Male Poverty
Demographics Similar to Soviet Union by Male Poverty
In terms of male poverty, the demographic groups most similar to Soviet Union are Immigrants from Northern Africa (11.1%, a difference of 0.070%), Taiwanese (11.0%, a difference of 0.25%), Colombian (11.0%, a difference of 0.28%), Immigrants from Chile (11.1%, a difference of 0.30%), and Scotch-Irish (11.0%, a difference of 0.35%).
| Demographics | Rating | Rank | Male Poverty |
| Immigrants | Bosnia and Herzegovina | 65.2 /100 | #153 | Good 11.0% |
| Immigrants | Kazakhstan | 64.8 /100 | #154 | Good 11.0% |
| Immigrants | Malaysia | 64.7 /100 | #155 | Good 11.0% |
| Costa Ricans | 63.9 /100 | #156 | Good 11.0% |
| Scotch-Irish | 63.7 /100 | #157 | Good 11.0% |
| Colombians | 63.0 /100 | #158 | Good 11.0% |
| Taiwanese | 62.7 /100 | #159 | Good 11.0% |
| Soviet Union | 60.3 /100 | #160 | Good 11.1% |
| Immigrants | Northern Africa | 59.7 /100 | #161 | Average 11.1% |
| Immigrants | Chile | 57.4 /100 | #162 | Average 11.1% |
| Whites/Caucasians | 56.7 /100 | #163 | Average 11.1% |
| Ethiopians | 56.7 /100 | #164 | Average 11.1% |
| Immigrants | Spain | 55.5 /100 | #165 | Average 11.1% |
| Immigrants | Albania | 55.3 /100 | #166 | Average 11.1% |
| Hungarians | 55.1 /100 | #167 | Average 11.1% |
Demographics Similar to Immigrants from Jamaica by Male Poverty
In terms of male poverty, the demographic groups most similar to Immigrants from Jamaica are Subsaharan African (13.3%, a difference of 0.030%), Immigrants from Guyana (13.2%, a difference of 0.11%), Guyanese (13.3%, a difference of 0.25%), Jamaican (13.2%, a difference of 0.26%), and Iroquois (13.2%, a difference of 0.28%).
| Demographics | Rating | Rank | Male Poverty |
| Ottawa | 0.1 /100 | #260 | Tragic 13.1% |
| Trinidadians and Tobagonians | 0.1 /100 | #261 | Tragic 13.1% |
| Spanish American Indians | 0.1 /100 | #262 | Tragic 13.1% |
| Central Americans | 0.1 /100 | #263 | Tragic 13.2% |
| Iroquois | 0.1 /100 | #264 | Tragic 13.2% |
| Jamaicans | 0.1 /100 | #265 | Tragic 13.2% |
| Immigrants | Guyana | 0.1 /100 | #266 | Tragic 13.2% |
| Immigrants | Jamaica | 0.1 /100 | #267 | Tragic 13.3% |
| Sub-Saharan Africans | 0.1 /100 | #268 | Tragic 13.3% |
| Guyanese | 0.0 /100 | #269 | Tragic 13.3% |
| Cree | 0.0 /100 | #270 | Tragic 13.3% |
| Spanish Americans | 0.0 /100 | #271 | Tragic 13.4% |
| Immigrants | Bahamas | 0.0 /100 | #272 | Tragic 13.5% |
| Chickasaw | 0.0 /100 | #273 | Tragic 13.5% |
| Immigrants | West Indies | 0.0 /100 | #274 | Tragic 13.5% |