South American vs Scotch-Irish Child Poverty Among Boys Under 16
COMPARE
South American
Scotch-Irish
Child Poverty Among Boys Under 16
Child Poverty Among Boys Under 16 Comparison
South Americans
Scotch-Irish
16.3%
CHILD POVERTY AMONG BOYS UNDER 16
55.3/ 100
METRIC RATING
168th/ 347
METRIC RANK
16.5%
CHILD POVERTY AMONG BOYS UNDER 16
47.5/ 100
METRIC RATING
178th/ 347
METRIC RANK
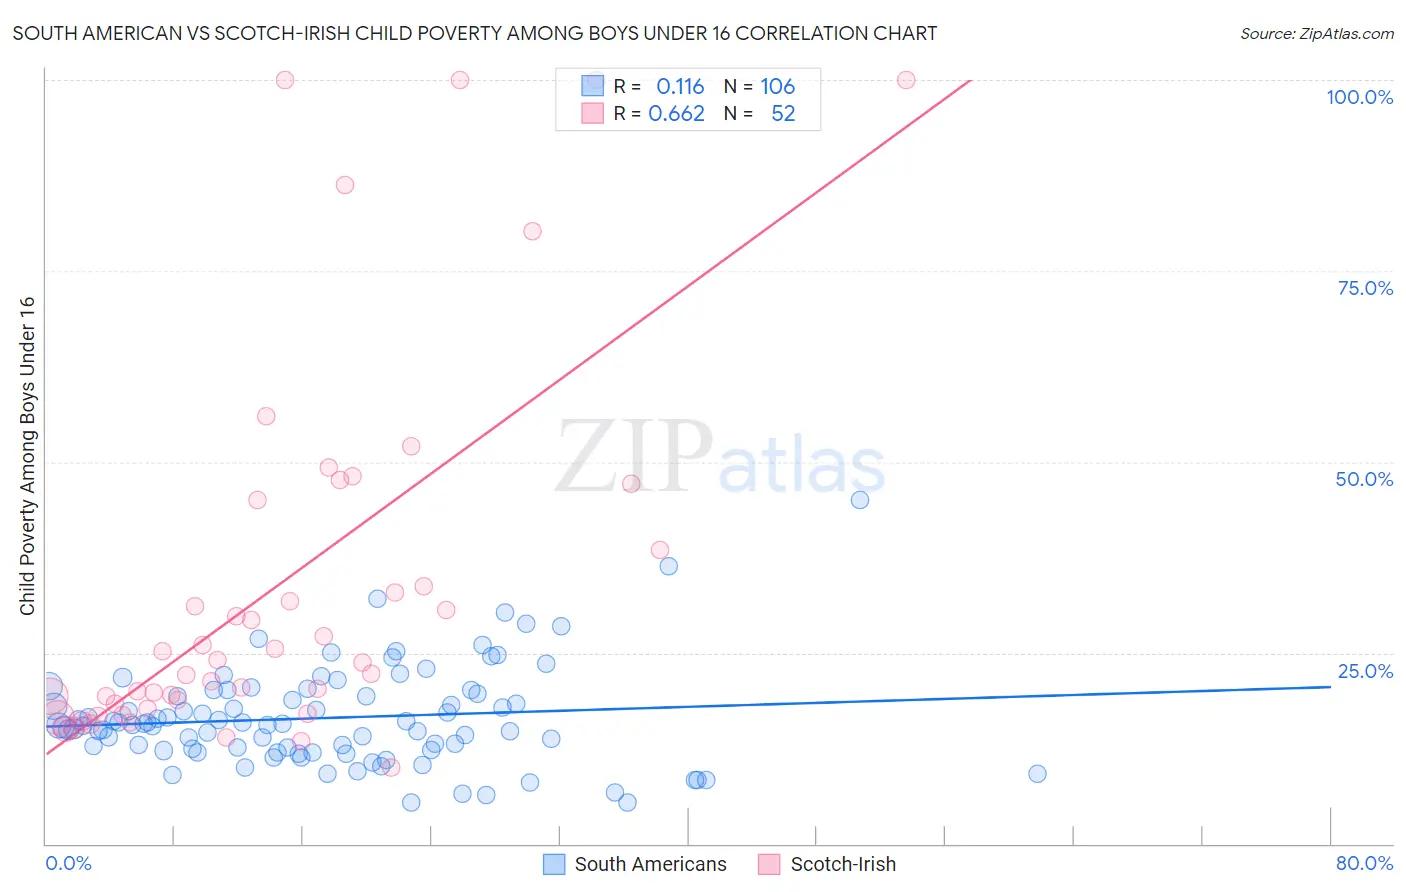
South American vs Scotch-Irish Child Poverty Among Boys Under 16 Correlation Chart
The statistical analysis conducted on geographies consisting of 482,291,014 people shows a poor positive correlation between the proportion of South Americans and poverty level among boys under the age of 16 in the United States with a correlation coefficient (R) of 0.116 and weighted average of 16.3%. Similarly, the statistical analysis conducted on geographies consisting of 530,822,758 people shows a significant positive correlation between the proportion of Scotch-Irish and poverty level among boys under the age of 16 in the United States with a correlation coefficient (R) of 0.662 and weighted average of 16.5%, a difference of 0.87%.
Child Poverty Among Boys Under 16 Correlation Summary
| Measurement | South American | Scotch-Irish |
| Minimum | 5.4% | 10.0% |
| Maximum | 45.1% | 100.0% |
| Range | 39.7% | 90.0% |
| Mean | 16.5% | 33.9% |
| Median | 15.5% | 23.9% |
| Interquartile 25% (IQ1) | 12.3% | 18.0% |
| Interquartile 75% (IQ3) | 19.7% | 41.8% |
| Interquartile Range (IQR) | 7.4% | 23.8% |
| Standard Deviation (Sample) | 6.5% | 24.8% |
| Standard Deviation (Population) | 6.5% | 24.6% |
Demographics Similar to South Americans and Scotch-Irish by Child Poverty Among Boys Under 16
In terms of child poverty among boys under 16, the demographic groups most similar to South Americans are Afghan (16.3%, a difference of 0.010%), Immigrants from Saudi Arabia (16.4%, a difference of 0.19%), Immigrants from Bosnia and Herzegovina (16.4%, a difference of 0.40%), Immigrants from Ethiopia (16.4%, a difference of 0.45%), and Immigrants from Colombia (16.4%, a difference of 0.51%). Similarly, the demographic groups most similar to Scotch-Irish are Hungarian (16.5%, a difference of 0.020%), Ethiopian (16.5%, a difference of 0.040%), White/Caucasian (16.5%, a difference of 0.080%), Immigrants from Syria (16.5%, a difference of 0.17%), and Hawaiian (16.5%, a difference of 0.22%).
| Demographics | Rating | Rank | Child Poverty Among Boys Under 16 |
| Costa Ricans | 68.1 /100 | #163 | Good 16.1% |
| Immigrants | Albania | 67.9 /100 | #164 | Good 16.1% |
| Colombians | 65.2 /100 | #165 | Good 16.1% |
| Immigrants | Germany | 63.6 /100 | #166 | Good 16.2% |
| Afghans | 55.4 /100 | #167 | Average 16.3% |
| South Americans | 55.3 /100 | #168 | Average 16.3% |
| Immigrants | Saudi Arabia | 53.6 /100 | #169 | Average 16.4% |
| Immigrants | Bosnia and Herzegovina | 51.7 /100 | #170 | Average 16.4% |
| Immigrants | Ethiopia | 51.3 /100 | #171 | Average 16.4% |
| Immigrants | Colombia | 50.8 /100 | #172 | Average 16.4% |
| Tsimshian | 50.5 /100 | #173 | Average 16.4% |
| Uruguayans | 50.0 /100 | #174 | Average 16.4% |
| Immigrants | Syria | 49.0 /100 | #175 | Average 16.5% |
| Whites/Caucasians | 48.2 /100 | #176 | Average 16.5% |
| Ethiopians | 47.8 /100 | #177 | Average 16.5% |
| Scotch-Irish | 47.5 /100 | #178 | Average 16.5% |
| Hungarians | 47.3 /100 | #179 | Average 16.5% |
| Hawaiians | 45.5 /100 | #180 | Average 16.5% |
| South American Indians | 44.3 /100 | #181 | Average 16.5% |
| Lebanese | 43.3 /100 | #182 | Average 16.6% |
| Kenyans | 41.0 /100 | #183 | Average 16.6% |