South American vs Nepalese Female Poverty
COMPARE
South American
Nepalese
Female Poverty
Female Poverty Comparison
South Americans
Nepalese
13.5%
FEMALE POVERTY
44.8/ 100
METRIC RATING
180th/ 347
METRIC RANK
15.2%
FEMALE POVERTY
0.4/ 100
METRIC RATING
242nd/ 347
METRIC RANK
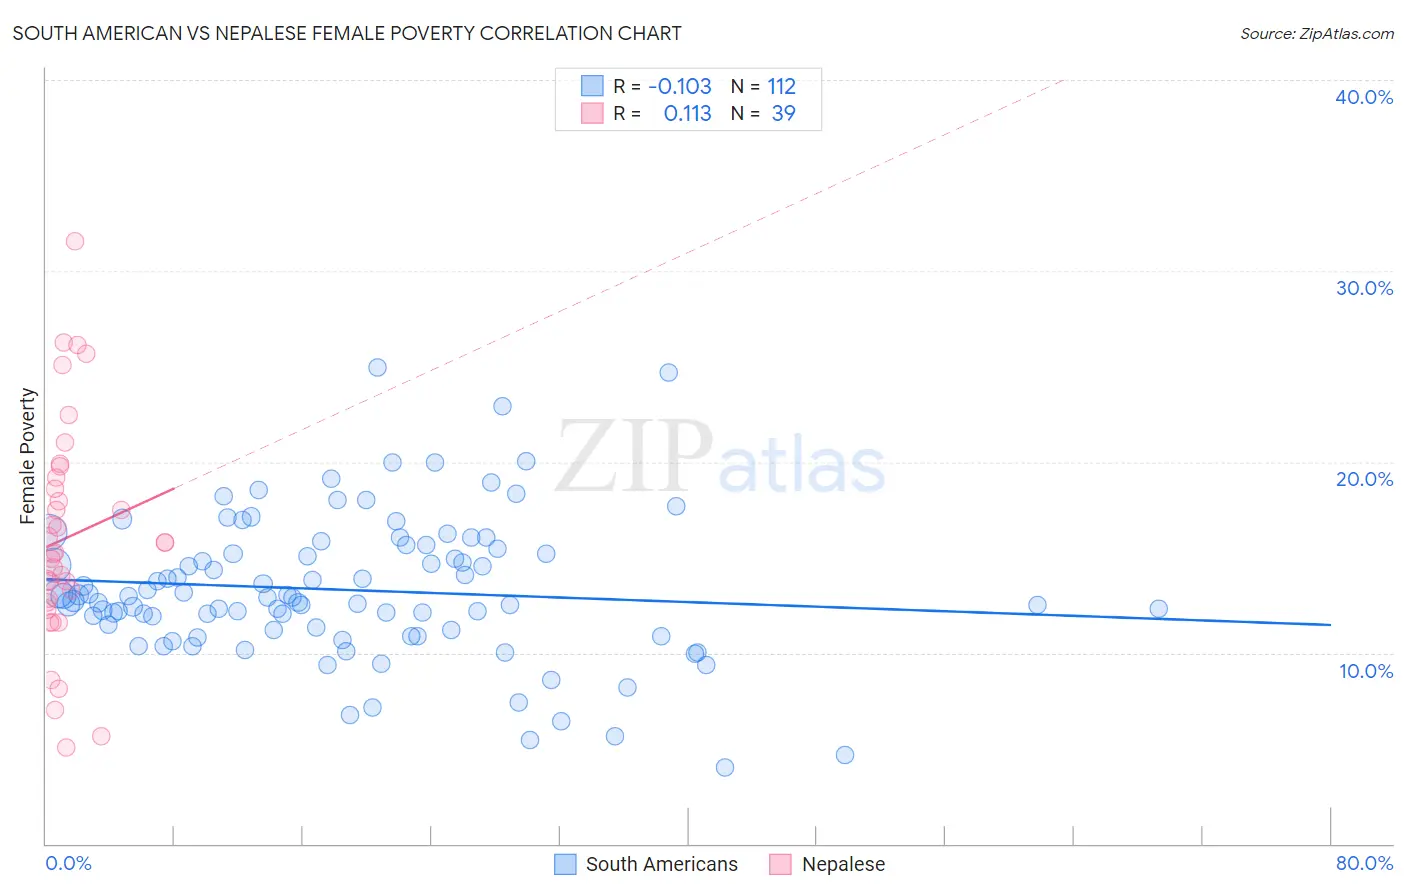
South American vs Nepalese Female Poverty Correlation Chart
The statistical analysis conducted on geographies consisting of 493,491,329 people shows a poor negative correlation between the proportion of South Americans and poverty level among females in the United States with a correlation coefficient (R) of -0.103 and weighted average of 13.5%. Similarly, the statistical analysis conducted on geographies consisting of 24,519,269 people shows a poor positive correlation between the proportion of Nepalese and poverty level among females in the United States with a correlation coefficient (R) of 0.113 and weighted average of 15.2%, a difference of 12.8%.
Female Poverty Correlation Summary
| Measurement | South American | Nepalese |
| Minimum | 4.0% | 5.1% |
| Maximum | 25.0% | 31.6% |
| Range | 21.0% | 26.5% |
| Mean | 13.3% | 16.0% |
| Median | 12.9% | 15.3% |
| Interquartile 25% (IQ1) | 11.2% | 12.6% |
| Interquartile 75% (IQ3) | 15.3% | 19.2% |
| Interquartile Range (IQR) | 4.2% | 6.5% |
| Standard Deviation (Sample) | 3.7% | 5.8% |
| Standard Deviation (Population) | 3.7% | 5.8% |
Similar Demographics by Female Poverty
Demographics Similar to South Americans by Female Poverty
In terms of female poverty, the demographic groups most similar to South Americans are Venezuelan (13.5%, a difference of 0.030%), Immigrants from Colombia (13.5%, a difference of 0.030%), Kenyan (13.5%, a difference of 0.10%), Immigrants from Sierra Leone (13.5%, a difference of 0.16%), and Immigrants from Cameroon (13.5%, a difference of 0.27%).
| Demographics | Rating | Rank | Female Poverty |
| Immigrants | Afghanistan | 50.8 /100 | #173 | Average 13.4% |
| Immigrants | Iraq | 50.0 /100 | #174 | Average 13.4% |
| Celtics | 49.9 /100 | #175 | Average 13.4% |
| Immigrants | Spain | 49.9 /100 | #176 | Average 13.4% |
| Immigrants | Morocco | 49.4 /100 | #177 | Average 13.4% |
| Israelis | 49.1 /100 | #178 | Average 13.5% |
| Immigrants | Syria | 48.8 /100 | #179 | Average 13.5% |
| South Americans | 44.8 /100 | #180 | Average 13.5% |
| Venezuelans | 44.5 /100 | #181 | Average 13.5% |
| Immigrants | Colombia | 44.5 /100 | #182 | Average 13.5% |
| Kenyans | 43.8 /100 | #183 | Average 13.5% |
| Immigrants | Sierra Leone | 43.2 /100 | #184 | Average 13.5% |
| Immigrants | Cameroon | 42.0 /100 | #185 | Average 13.5% |
| Immigrants | Portugal | 41.5 /100 | #186 | Average 13.6% |
| Immigrants | Venezuela | 41.0 /100 | #187 | Average 13.6% |
Demographics Similar to Nepalese by Female Poverty
In terms of female poverty, the demographic groups most similar to Nepalese are Immigrants from Sudan (15.2%, a difference of 0.12%), Nicaraguan (15.3%, a difference of 0.24%), Ecuadorian (15.3%, a difference of 0.29%), Sudanese (15.2%, a difference of 0.37%), and Spanish American Indian (15.3%, a difference of 0.39%).
| Demographics | Rating | Rank | Female Poverty |
| Immigrants | Laos | 0.9 /100 | #235 | Tragic 15.0% |
| Cree | 0.7 /100 | #236 | Tragic 15.1% |
| French American Indians | 0.6 /100 | #237 | Tragic 15.1% |
| Immigrants | Armenia | 0.6 /100 | #238 | Tragic 15.1% |
| Immigrants | Middle Africa | 0.5 /100 | #239 | Tragic 15.2% |
| Sudanese | 0.5 /100 | #240 | Tragic 15.2% |
| Immigrants | Sudan | 0.4 /100 | #241 | Tragic 15.2% |
| Nepalese | 0.4 /100 | #242 | Tragic 15.2% |
| Nicaraguans | 0.3 /100 | #243 | Tragic 15.3% |
| Ecuadorians | 0.3 /100 | #244 | Tragic 15.3% |
| Spanish American Indians | 0.3 /100 | #245 | Tragic 15.3% |
| Cubans | 0.3 /100 | #246 | Tragic 15.3% |
| Potawatomi | 0.3 /100 | #247 | Tragic 15.3% |
| Immigrants | Ghana | 0.3 /100 | #248 | Tragic 15.3% |
| Salvadorans | 0.3 /100 | #249 | Tragic 15.3% |