South American vs Cypriot Child Poverty Among Girls Under 16
COMPARE
South American
Cypriot
Child Poverty Among Girls Under 16
Child Poverty Among Girls Under 16 Comparison
South Americans
Cypriots
16.1%
CHILD POVERTY AMONG GIRLS UNDER 16
67.2/ 100
METRIC RATING
166th/ 347
METRIC RANK
13.2%
CHILD POVERTY AMONG GIRLS UNDER 16
99.9/ 100
METRIC RATING
19th/ 347
METRIC RANK
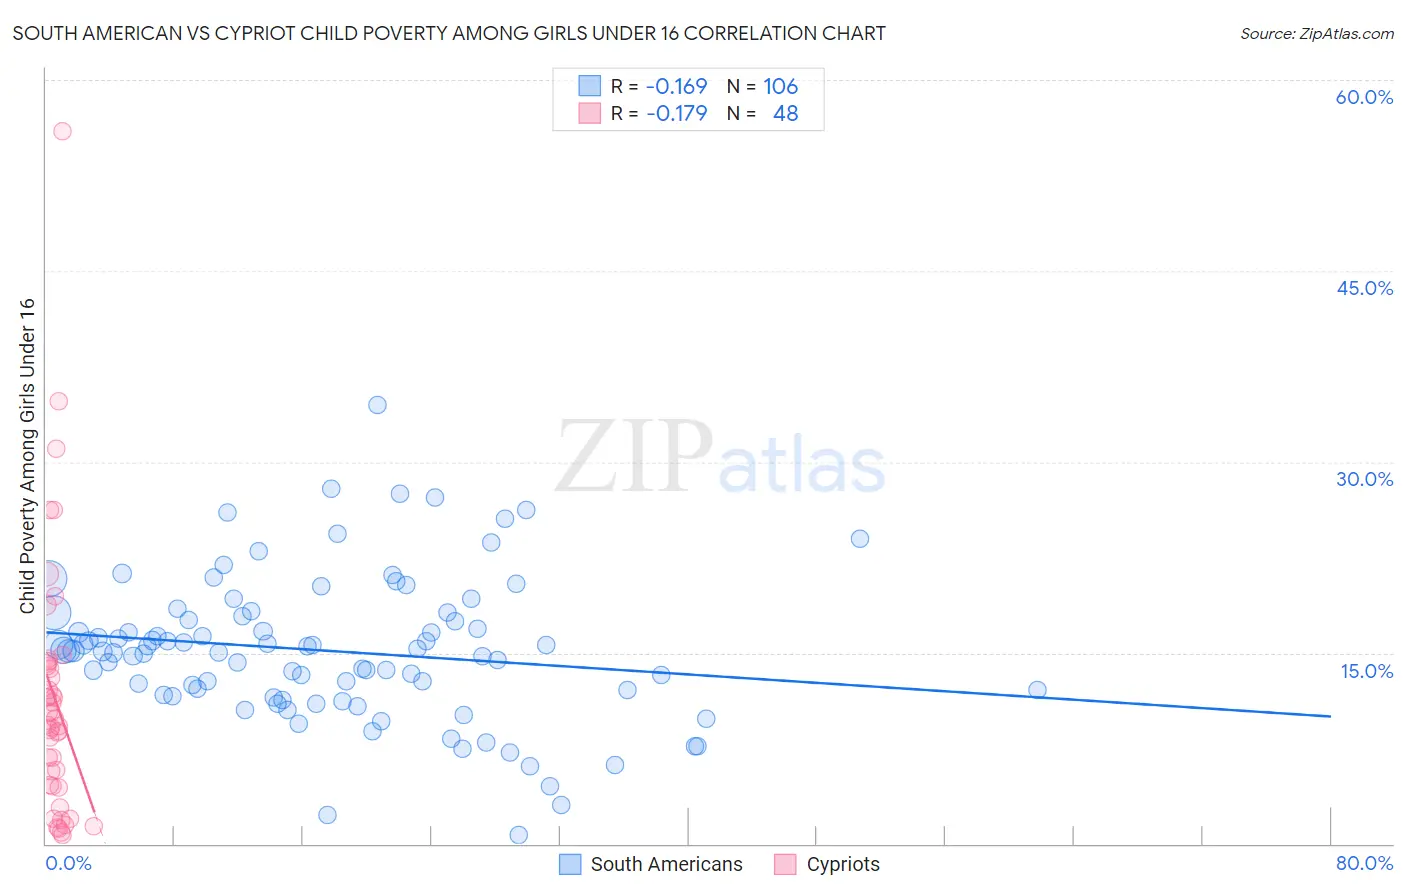
South American vs Cypriot Child Poverty Among Girls Under 16 Correlation Chart
The statistical analysis conducted on geographies consisting of 481,449,574 people shows a poor negative correlation between the proportion of South Americans and poverty level among girls under the age of 16 in the United States with a correlation coefficient (R) of -0.169 and weighted average of 16.1%. Similarly, the statistical analysis conducted on geographies consisting of 61,269,149 people shows a poor negative correlation between the proportion of Cypriots and poverty level among girls under the age of 16 in the United States with a correlation coefficient (R) of -0.179 and weighted average of 13.2%, a difference of 22.2%.
Child Poverty Among Girls Under 16 Correlation Summary
| Measurement | South American | Cypriot |
| Minimum | 0.69% | 0.71% |
| Maximum | 34.5% | 55.9% |
| Range | 33.8% | 55.2% |
| Mean | 15.2% | 11.4% |
| Median | 15.1% | 9.6% |
| Interquartile 25% (IQ1) | 11.7% | 4.6% |
| Interquartile 75% (IQ3) | 17.9% | 14.1% |
| Interquartile Range (IQR) | 6.2% | 9.5% |
| Standard Deviation (Sample) | 5.7% | 10.2% |
| Standard Deviation (Population) | 5.7% | 10.1% |
Similar Demographics by Child Poverty Among Girls Under 16
Demographics Similar to South Americans by Child Poverty Among Girls Under 16
In terms of child poverty among girls under 16, the demographic groups most similar to South Americans are Immigrants from Germany (16.1%, a difference of 0.020%), Immigrants from Colombia (16.1%, a difference of 0.090%), Immigrants from Oceania (16.1%, a difference of 0.16%), French Canadian (16.1%, a difference of 0.21%), and Uruguayan (16.2%, a difference of 0.32%).
| Demographics | Rating | Rank | Child Poverty Among Girls Under 16 |
| Slovaks | 75.2 /100 | #159 | Good 15.9% |
| French | 72.8 /100 | #160 | Good 16.0% |
| Immigrants | Northern Africa | 72.0 /100 | #161 | Good 16.0% |
| French Canadians | 68.7 /100 | #162 | Good 16.1% |
| Immigrants | Oceania | 68.4 /100 | #163 | Good 16.1% |
| Immigrants | Colombia | 67.8 /100 | #164 | Good 16.1% |
| Immigrants | Germany | 67.3 /100 | #165 | Good 16.1% |
| South Americans | 67.2 /100 | #166 | Good 16.1% |
| Uruguayans | 64.7 /100 | #167 | Good 16.2% |
| Yugoslavians | 64.4 /100 | #168 | Good 16.2% |
| Costa Ricans | 64.2 /100 | #169 | Good 16.2% |
| Immigrants | Venezuela | 64.2 /100 | #170 | Good 16.2% |
| Immigrants | Saudi Arabia | 64.0 /100 | #171 | Good 16.2% |
| Afghans | 62.3 /100 | #172 | Good 16.2% |
| Immigrants | South America | 55.1 /100 | #173 | Average 16.4% |
Demographics Similar to Cypriots by Child Poverty Among Girls Under 16
In terms of child poverty among girls under 16, the demographic groups most similar to Cypriots are Immigrants from Korea (13.1%, a difference of 0.37%), Bulgarian (13.1%, a difference of 0.39%), Immigrants from Lithuania (13.1%, a difference of 0.47%), Immigrants from Japan (13.3%, a difference of 0.66%), and Assyrian/Chaldean/Syriac (13.3%, a difference of 0.78%).
| Demographics | Rating | Rank | Child Poverty Among Girls Under 16 |
| Bhutanese | 100.0 /100 | #12 | Exceptional 12.7% |
| Immigrants | Ireland | 99.9 /100 | #13 | Exceptional 12.9% |
| Burmese | 99.9 /100 | #14 | Exceptional 13.0% |
| Okinawans | 99.9 /100 | #15 | Exceptional 13.0% |
| Immigrants | Lithuania | 99.9 /100 | #16 | Exceptional 13.1% |
| Bulgarians | 99.9 /100 | #17 | Exceptional 13.1% |
| Immigrants | Korea | 99.9 /100 | #18 | Exceptional 13.1% |
| Cypriots | 99.9 /100 | #19 | Exceptional 13.2% |
| Immigrants | Japan | 99.9 /100 | #20 | Exceptional 13.3% |
| Assyrians/Chaldeans/Syriacs | 99.9 /100 | #21 | Exceptional 13.3% |
| Indians (Asian) | 99.9 /100 | #22 | Exceptional 13.3% |
| Norwegians | 99.9 /100 | #23 | Exceptional 13.3% |
| Immigrants | Eastern Asia | 99.9 /100 | #24 | Exceptional 13.4% |
| Immigrants | China | 99.8 /100 | #25 | Exceptional 13.4% |
| Eastern Europeans | 99.8 /100 | #26 | Exceptional 13.5% |