South American Indian vs Immigrants from Peru Child Poverty Among Boys Under 16
COMPARE
South American Indian
Immigrants from Peru
Child Poverty Among Boys Under 16
Child Poverty Among Boys Under 16 Comparison
South American Indians
Immigrants from Peru
16.5%
CHILD POVERTY AMONG BOYS UNDER 16
44.3/ 100
METRIC RATING
181st/ 347
METRIC RANK
15.7%
CHILD POVERTY AMONG BOYS UNDER 16
83.5/ 100
METRIC RATING
144th/ 347
METRIC RANK
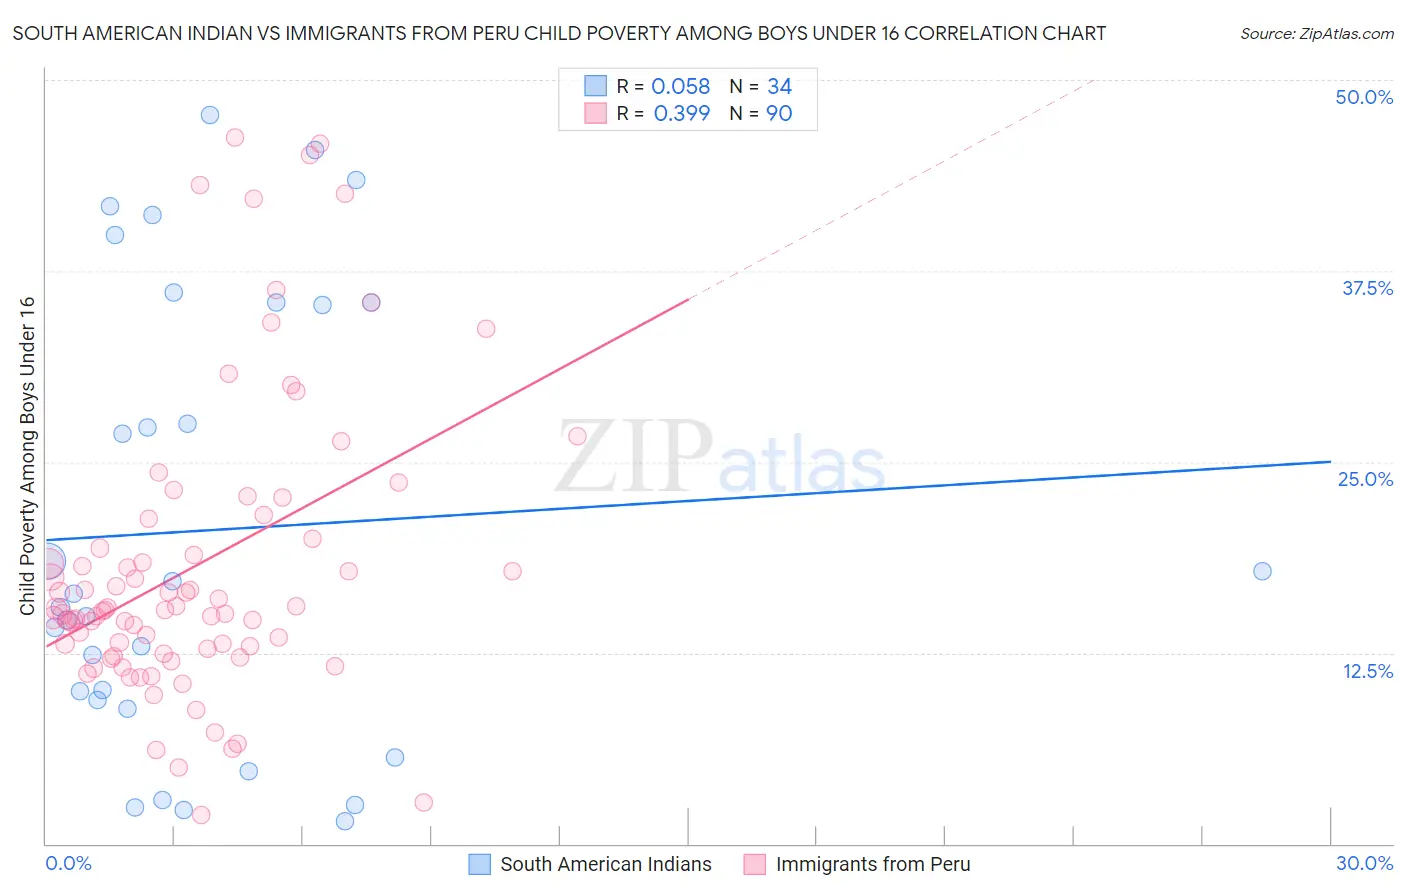
South American Indian vs Immigrants from Peru Child Poverty Among Boys Under 16 Correlation Chart
The statistical analysis conducted on geographies consisting of 163,628,947 people shows a slight positive correlation between the proportion of South American Indians and poverty level among boys under the age of 16 in the United States with a correlation coefficient (R) of 0.058 and weighted average of 16.5%. Similarly, the statistical analysis conducted on geographies consisting of 324,822,417 people shows a mild positive correlation between the proportion of Immigrants from Peru and poverty level among boys under the age of 16 in the United States with a correlation coefficient (R) of 0.399 and weighted average of 15.7%, a difference of 5.4%.
Child Poverty Among Boys Under 16 Correlation Summary
| Measurement | South American Indian | Immigrants from Peru |
| Minimum | 1.4% | 1.9% |
| Maximum | 47.7% | 46.2% |
| Range | 46.2% | 44.3% |
| Mean | 20.5% | 18.2% |
| Median | 15.9% | 15.3% |
| Interquartile 25% (IQ1) | 9.4% | 12.8% |
| Interquartile 75% (IQ3) | 35.4% | 20.0% |
| Interquartile Range (IQR) | 26.0% | 7.2% |
| Standard Deviation (Sample) | 14.7% | 9.7% |
| Standard Deviation (Population) | 14.4% | 9.6% |
Similar Demographics by Child Poverty Among Boys Under 16
Demographics Similar to South American Indians by Child Poverty Among Boys Under 16
In terms of child poverty among boys under 16, the demographic groups most similar to South American Indians are Lebanese (16.6%, a difference of 0.11%), Hawaiian (16.5%, a difference of 0.14%), Hungarian (16.5%, a difference of 0.34%), Scotch-Irish (16.5%, a difference of 0.36%), and Kenyan (16.6%, a difference of 0.38%).
| Demographics | Rating | Rank | Child Poverty Among Boys Under 16 |
| Uruguayans | 50.0 /100 | #174 | Average 16.4% |
| Immigrants | Syria | 49.0 /100 | #175 | Average 16.5% |
| Whites/Caucasians | 48.2 /100 | #176 | Average 16.5% |
| Ethiopians | 47.8 /100 | #177 | Average 16.5% |
| Scotch-Irish | 47.5 /100 | #178 | Average 16.5% |
| Hungarians | 47.3 /100 | #179 | Average 16.5% |
| Hawaiians | 45.5 /100 | #180 | Average 16.5% |
| South American Indians | 44.3 /100 | #181 | Average 16.5% |
| Lebanese | 43.3 /100 | #182 | Average 16.6% |
| Kenyans | 41.0 /100 | #183 | Average 16.6% |
| Celtics | 40.6 /100 | #184 | Average 16.6% |
| Immigrants | Western Asia | 40.4 /100 | #185 | Average 16.6% |
| Hmong | 38.4 /100 | #186 | Fair 16.6% |
| Immigrants | Costa Rica | 37.8 /100 | #187 | Fair 16.7% |
| Immigrants | South America | 37.7 /100 | #188 | Fair 16.7% |
Demographics Similar to Immigrants from Peru by Child Poverty Among Boys Under 16
In terms of child poverty among boys under 16, the demographic groups most similar to Immigrants from Peru are Immigrants from Fiji (15.7%, a difference of 0.020%), Samoan (15.7%, a difference of 0.060%), Immigrants from Hungary (15.7%, a difference of 0.13%), New Zealander (15.7%, a difference of 0.21%), and Slavic (15.7%, a difference of 0.22%).
| Demographics | Rating | Rank | Child Poverty Among Boys Under 16 |
| Immigrants | Spain | 87.1 /100 | #137 | Excellent 15.6% |
| Immigrants | Southern Europe | 86.5 /100 | #138 | Excellent 15.6% |
| Albanians | 86.5 /100 | #139 | Excellent 15.6% |
| Immigrants | Kuwait | 85.6 /100 | #140 | Excellent 15.6% |
| Slavs | 84.5 /100 | #141 | Excellent 15.7% |
| Immigrants | Hungary | 84.1 /100 | #142 | Excellent 15.7% |
| Immigrants | Fiji | 83.6 /100 | #143 | Excellent 15.7% |
| Immigrants | Peru | 83.5 /100 | #144 | Excellent 15.7% |
| Samoans | 83.2 /100 | #145 | Excellent 15.7% |
| New Zealanders | 82.4 /100 | #146 | Excellent 15.7% |
| Venezuelans | 82.1 /100 | #147 | Excellent 15.7% |
| Brazilians | 81.0 /100 | #148 | Excellent 15.8% |
| Slovaks | 80.3 /100 | #149 | Excellent 15.8% |
| Immigrants | Jordan | 80.2 /100 | #150 | Excellent 15.8% |
| Puget Sound Salish | 79.8 /100 | #151 | Good 15.8% |