South American Indian vs Immigrants from Korea Single Father Poverty
COMPARE
South American Indian
Immigrants from Korea
Single Father Poverty
Single Father Poverty Comparison
South American Indians
Immigrants from Korea
15.7%
SINGLE FATHER POVERTY
96.2/ 100
METRIC RATING
103rd/ 347
METRIC RANK
15.5%
SINGLE FATHER POVERTY
99.0/ 100
METRIC RATING
89th/ 347
METRIC RANK
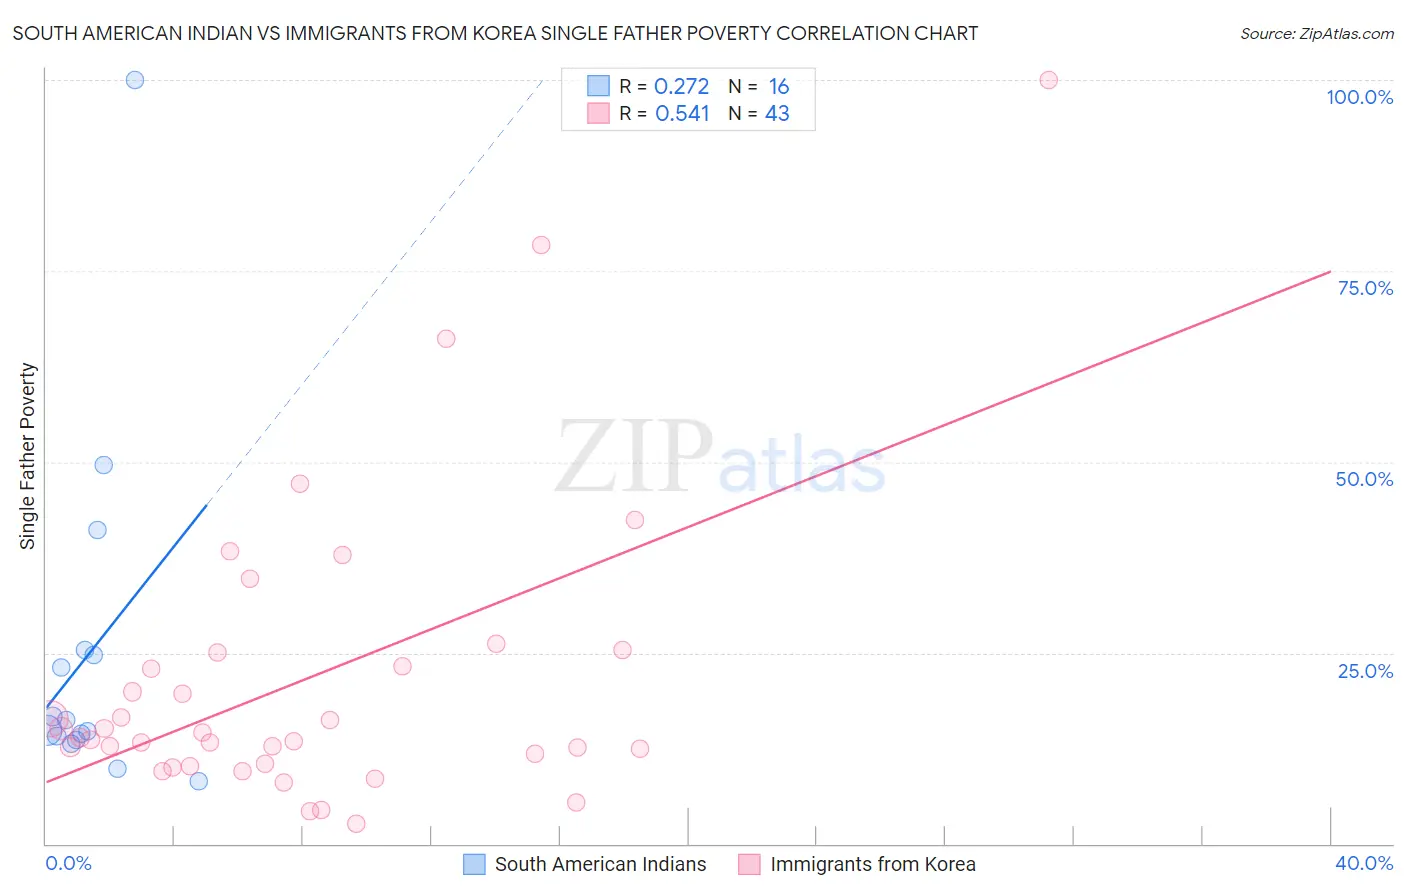
South American Indian vs Immigrants from Korea Single Father Poverty Correlation Chart
The statistical analysis conducted on geographies consisting of 144,417,675 people shows a weak positive correlation between the proportion of South American Indians and poverty level among single fathers in the United States with a correlation coefficient (R) of 0.272 and weighted average of 15.7%. Similarly, the statistical analysis conducted on geographies consisting of 322,299,273 people shows a substantial positive correlation between the proportion of Immigrants from Korea and poverty level among single fathers in the United States with a correlation coefficient (R) of 0.541 and weighted average of 15.5%, a difference of 1.5%.
Single Father Poverty Correlation Summary
| Measurement | South American Indian | Immigrants from Korea |
| Minimum | 8.2% | 2.7% |
| Maximum | 100.0% | 100.0% |
| Range | 91.8% | 97.3% |
| Mean | 25.0% | 21.6% |
| Median | 15.6% | 13.9% |
| Interquartile 25% (IQ1) | 13.8% | 10.5% |
| Interquartile 75% (IQ3) | 25.0% | 25.0% |
| Interquartile Range (IQR) | 11.2% | 14.5% |
| Standard Deviation (Sample) | 22.9% | 19.8% |
| Standard Deviation (Population) | 22.2% | 19.6% |
Demographics Similar to South American Indians and Immigrants from Korea by Single Father Poverty
In terms of single father poverty, the demographic groups most similar to South American Indians are Australian (15.7%, a difference of 0.020%), Immigrants from Australia (15.7%, a difference of 0.030%), Chilean (15.7%, a difference of 0.060%), Immigrants from Poland (15.7%, a difference of 0.11%), and Fijian (15.7%, a difference of 0.22%). Similarly, the demographic groups most similar to Immigrants from Korea are Burmese (15.5%, a difference of 0.060%), Brazilian (15.5%, a difference of 0.090%), Immigrants from Russia (15.5%, a difference of 0.10%), Mexican American Indian (15.5%, a difference of 0.23%), and Immigrants from Romania (15.5%, a difference of 0.34%).
| Demographics | Rating | Rank | Single Father Poverty |
| Immigrants | Russia | 99.0 /100 | #86 | Exceptional 15.5% |
| Brazilians | 99.0 /100 | #87 | Exceptional 15.5% |
| Burmese | 99.0 /100 | #88 | Exceptional 15.5% |
| Immigrants | Korea | 99.0 /100 | #89 | Exceptional 15.5% |
| Mexican American Indians | 98.7 /100 | #90 | Exceptional 15.5% |
| Immigrants | Romania | 98.6 /100 | #91 | Exceptional 15.5% |
| Immigrants | Serbia | 98.5 /100 | #92 | Exceptional 15.5% |
| Basques | 98.4 /100 | #93 | Exceptional 15.5% |
| Immigrants | Uruguay | 98.2 /100 | #94 | Exceptional 15.6% |
| Immigrants | Kazakhstan | 98.2 /100 | #95 | Exceptional 15.6% |
| Immigrants | Belgium | 98.1 /100 | #96 | Exceptional 15.6% |
| Yaqui | 98.1 /100 | #97 | Exceptional 15.6% |
| Zimbabweans | 98.1 /100 | #98 | Exceptional 15.6% |
| Immigrants | Middle Africa | 97.4 /100 | #99 | Exceptional 15.6% |
| Immigrants | Chile | 96.9 /100 | #100 | Exceptional 15.7% |
| Fijians | 96.8 /100 | #101 | Exceptional 15.7% |
| Chileans | 96.4 /100 | #102 | Exceptional 15.7% |
| South American Indians | 96.2 /100 | #103 | Exceptional 15.7% |
| Australians | 96.1 /100 | #104 | Exceptional 15.7% |
| Immigrants | Australia | 96.1 /100 | #105 | Exceptional 15.7% |
| Immigrants | Poland | 95.8 /100 | #106 | Exceptional 15.7% |