South American Indian vs Immigrants from Indonesia Child Poverty Under the Age of 16
COMPARE
South American Indian
Immigrants from Indonesia
Child Poverty Under the Age of 16
Child Poverty Under the Age of 16 Comparison
South American Indians
Immigrants from Indonesia
16.4%
CHILD POVERTY UNDER THE AGE OF 16
41.8/ 100
METRIC RATING
180th/ 347
METRIC RANK
14.1%
CHILD POVERTY UNDER THE AGE OF 16
98.7/ 100
METRIC RATING
55th/ 347
METRIC RANK
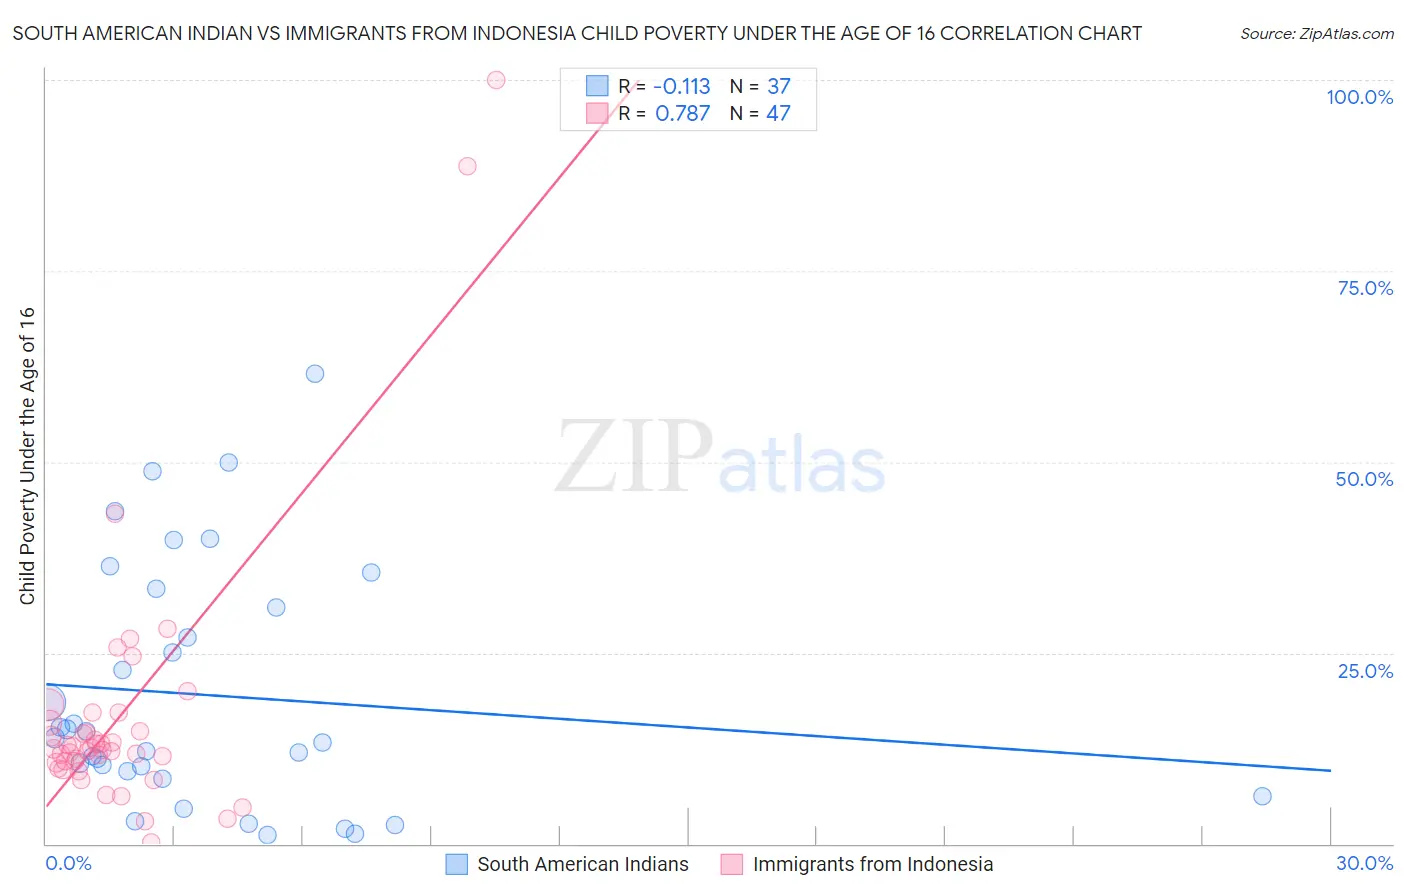
South American Indian vs Immigrants from Indonesia Child Poverty Under the Age of 16 Correlation Chart
The statistical analysis conducted on geographies consisting of 164,199,892 people shows a poor negative correlation between the proportion of South American Indians and poverty level among children under the age of 16 in the United States with a correlation coefficient (R) of -0.113 and weighted average of 16.4%. Similarly, the statistical analysis conducted on geographies consisting of 214,848,631 people shows a strong positive correlation between the proportion of Immigrants from Indonesia and poverty level among children under the age of 16 in the United States with a correlation coefficient (R) of 0.787 and weighted average of 14.1%, a difference of 16.1%.
Child Poverty Under the Age of 16 Correlation Summary
| Measurement | South American Indian | Immigrants from Indonesia |
| Minimum | 1.2% | 0.17% |
| Maximum | 61.5% | 100.0% |
| Range | 60.3% | 99.8% |
| Mean | 19.4% | 16.9% |
| Median | 13.9% | 12.4% |
| Interquartile 25% (IQ1) | 9.0% | 10.7% |
| Interquartile 75% (IQ3) | 32.2% | 15.8% |
| Interquartile Range (IQR) | 23.2% | 5.2% |
| Standard Deviation (Sample) | 15.8% | 18.0% |
| Standard Deviation (Population) | 15.6% | 17.8% |
Similar Demographics by Child Poverty Under the Age of 16
Demographics Similar to South American Indians by Child Poverty Under the Age of 16
In terms of child poverty under the age of 16, the demographic groups most similar to South American Indians are Immigrants from Syria (16.4%, a difference of 0.050%), Immigrants from Ethiopia (16.4%, a difference of 0.060%), Immigrants from South America (16.4%, a difference of 0.12%), Ethiopian (16.3%, a difference of 0.19%), and Hawaiian (16.4%, a difference of 0.45%).
| Demographics | Rating | Rank | Child Poverty Under the Age of 16 |
| Immigrants | Saudi Arabia | 52.1 /100 | #173 | Average 16.2% |
| Whites/Caucasians | 50.0 /100 | #174 | Average 16.2% |
| Scotch-Irish | 47.1 /100 | #175 | Average 16.3% |
| Lebanese | 45.9 /100 | #176 | Average 16.3% |
| Ethiopians | 43.4 /100 | #177 | Average 16.3% |
| Immigrants | Ethiopia | 42.3 /100 | #178 | Average 16.4% |
| Immigrants | Syria | 42.3 /100 | #179 | Average 16.4% |
| South American Indians | 41.8 /100 | #180 | Average 16.4% |
| Immigrants | South America | 40.8 /100 | #181 | Average 16.4% |
| Hawaiians | 38.2 /100 | #182 | Fair 16.4% |
| Celtics | 38.2 /100 | #183 | Fair 16.4% |
| Immigrants | Western Asia | 38.0 /100 | #184 | Fair 16.4% |
| Immigrants | Bosnia and Herzegovina | 37.4 /100 | #185 | Fair 16.5% |
| Kenyans | 34.1 /100 | #186 | Fair 16.5% |
| Arabs | 31.4 /100 | #187 | Fair 16.6% |
Demographics Similar to Immigrants from Indonesia by Child Poverty Under the Age of 16
In terms of child poverty under the age of 16, the demographic groups most similar to Immigrants from Indonesia are Tsimshian (14.1%, a difference of 0.070%), Immigrants from Israel (14.1%, a difference of 0.090%), Immigrants from Serbia (14.1%, a difference of 0.17%), Immigrants from Belgium (14.1%, a difference of 0.26%), and Immigrants from Pakistan (14.1%, a difference of 0.28%).
| Demographics | Rating | Rank | Child Poverty Under the Age of 16 |
| Koreans | 99.2 /100 | #48 | Exceptional 13.9% |
| Italians | 99.2 /100 | #49 | Exceptional 13.9% |
| Immigrants | Czechoslovakia | 99.1 /100 | #50 | Exceptional 13.9% |
| Immigrants | Greece | 99.1 /100 | #51 | Exceptional 13.9% |
| Poles | 98.9 /100 | #52 | Exceptional 14.0% |
| Immigrants | Israel | 98.8 /100 | #53 | Exceptional 14.1% |
| Tsimshian | 98.8 /100 | #54 | Exceptional 14.1% |
| Immigrants | Indonesia | 98.7 /100 | #55 | Exceptional 14.1% |
| Immigrants | Serbia | 98.7 /100 | #56 | Exceptional 14.1% |
| Immigrants | Belgium | 98.6 /100 | #57 | Exceptional 14.1% |
| Immigrants | Pakistan | 98.6 /100 | #58 | Exceptional 14.1% |
| Scandinavians | 98.6 /100 | #59 | Exceptional 14.1% |
| Immigrants | Austria | 98.5 /100 | #60 | Exceptional 14.2% |
| Immigrants | Sweden | 98.5 /100 | #61 | Exceptional 14.2% |
| Zimbabweans | 98.5 /100 | #62 | Exceptional 14.2% |