Somali vs Samoan Poverty
COMPARE
Somali
Samoan
Poverty
Poverty Comparison
Somalis
Samoans
15.4%
POVERTY
0.0/ 100
METRIC RATING
302nd/ 347
METRIC RANK
12.0%
POVERTY
71.9/ 100
METRIC RATING
151st/ 347
METRIC RANK
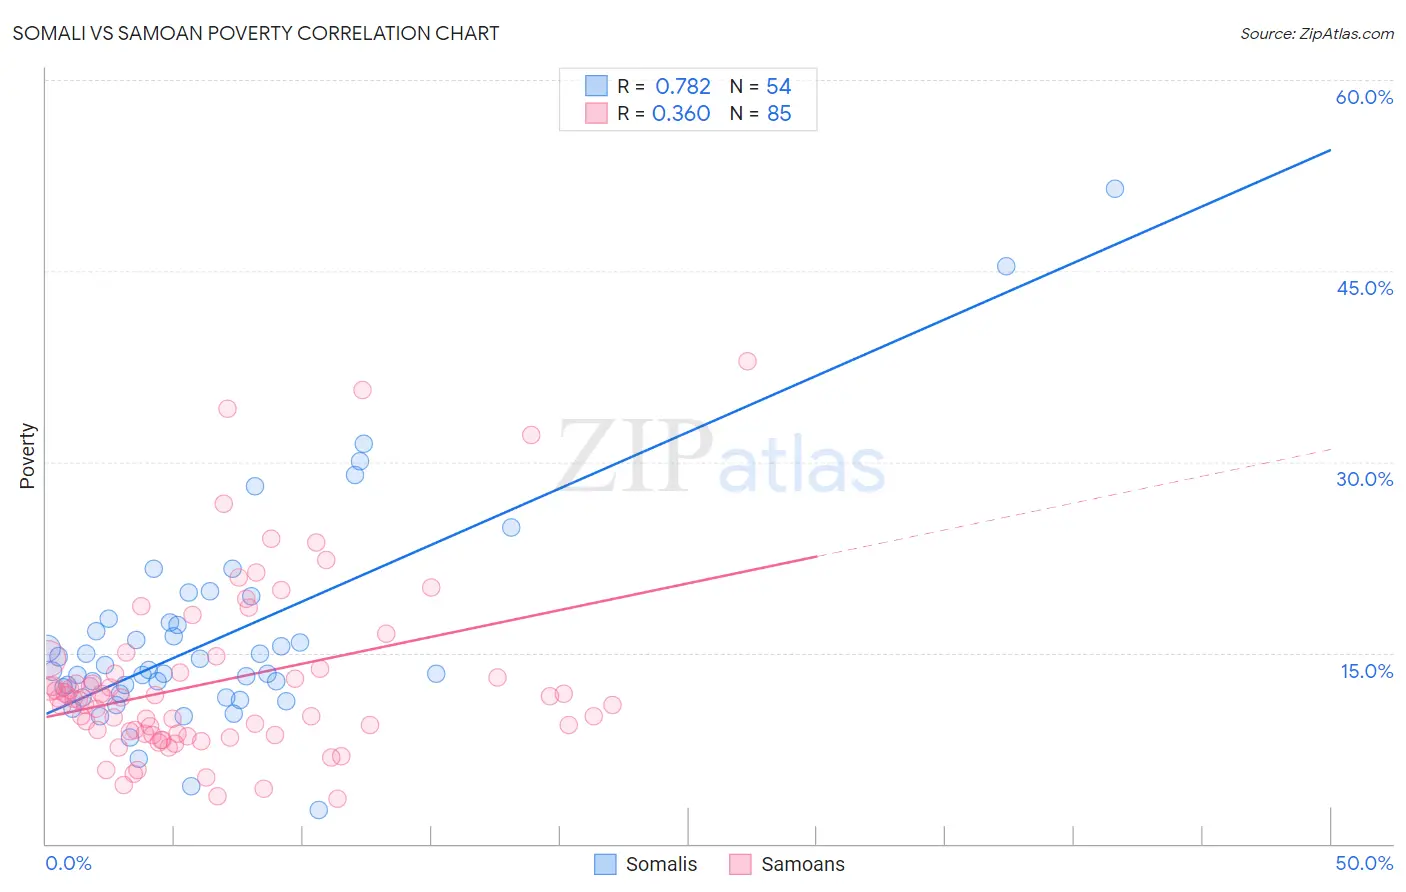
Somali vs Samoan Poverty Correlation Chart
The statistical analysis conducted on geographies consisting of 99,289,063 people shows a strong positive correlation between the proportion of Somalis and poverty level in the United States with a correlation coefficient (R) of 0.782 and weighted average of 15.4%. Similarly, the statistical analysis conducted on geographies consisting of 225,074,148 people shows a mild positive correlation between the proportion of Samoans and poverty level in the United States with a correlation coefficient (R) of 0.360 and weighted average of 12.0%, a difference of 28.0%.
Poverty Correlation Summary
| Measurement | Somali | Samoan |
| Minimum | 2.7% | 3.5% |
| Maximum | 51.5% | 37.9% |
| Range | 48.8% | 34.4% |
| Mean | 16.2% | 12.7% |
| Median | 13.6% | 11.4% |
| Interquartile 25% (IQ1) | 11.8% | 8.6% |
| Interquartile 75% (IQ3) | 17.4% | 13.6% |
| Interquartile Range (IQR) | 5.6% | 5.0% |
| Standard Deviation (Sample) | 8.6% | 6.9% |
| Standard Deviation (Population) | 8.5% | 6.8% |
Similar Demographics by Poverty
Demographics Similar to Somalis by Poverty
In terms of poverty, the demographic groups most similar to Somalis are Bahamian (15.4%, a difference of 0.13%), Immigrants from Central America (15.4%, a difference of 0.34%), Immigrants from Caribbean (15.5%, a difference of 0.48%), Immigrants from Mexico (15.5%, a difference of 0.57%), and Immigrants from Guatemala (15.5%, a difference of 0.61%).
| Demographics | Rating | Rank | Poverty |
| Guatemalans | 0.0 /100 | #295 | Tragic 15.3% |
| Hispanics or Latinos | 0.0 /100 | #296 | Tragic 15.3% |
| Immigrants | Bangladesh | 0.0 /100 | #297 | Tragic 15.3% |
| Immigrants | Senegal | 0.0 /100 | #298 | Tragic 15.3% |
| Senegalese | 0.0 /100 | #299 | Tragic 15.3% |
| Immigrants | Central America | 0.0 /100 | #300 | Tragic 15.4% |
| Bahamians | 0.0 /100 | #301 | Tragic 15.4% |
| Somalis | 0.0 /100 | #302 | Tragic 15.4% |
| Immigrants | Caribbean | 0.0 /100 | #303 | Tragic 15.5% |
| Immigrants | Mexico | 0.0 /100 | #304 | Tragic 15.5% |
| Immigrants | Guatemala | 0.0 /100 | #305 | Tragic 15.5% |
| Creek | 0.0 /100 | #306 | Tragic 15.6% |
| Africans | 0.0 /100 | #307 | Tragic 15.6% |
| Choctaw | 0.0 /100 | #308 | Tragic 15.6% |
| Seminole | 0.0 /100 | #309 | Tragic 15.6% |
Demographics Similar to Samoans by Poverty
In terms of poverty, the demographic groups most similar to Samoans are Immigrants from Kazakhstan (12.0%, a difference of 0.040%), Immigrants from Malaysia (12.0%, a difference of 0.090%), Immigrants from Germany (12.0%, a difference of 0.10%), Immigrants from Bosnia and Herzegovina (12.0%, a difference of 0.22%), and Afghan (12.0%, a difference of 0.38%).
| Demographics | Rating | Rank | Poverty |
| Icelanders | 77.9 /100 | #144 | Good 11.9% |
| Syrians | 75.1 /100 | #145 | Good 12.0% |
| Afghans | 74.9 /100 | #146 | Good 12.0% |
| Immigrants | Bosnia and Herzegovina | 73.7 /100 | #147 | Good 12.0% |
| Immigrants | Germany | 72.7 /100 | #148 | Good 12.0% |
| Immigrants | Malaysia | 72.7 /100 | #149 | Good 12.0% |
| Immigrants | Kazakhstan | 72.3 /100 | #150 | Good 12.0% |
| Samoans | 71.9 /100 | #151 | Good 12.0% |
| Armenians | 67.6 /100 | #152 | Good 12.1% |
| Immigrants | Northern Africa | 63.9 /100 | #153 | Good 12.1% |
| Guamanians/Chamorros | 63.9 /100 | #154 | Good 12.1% |
| Hungarians | 63.6 /100 | #155 | Good 12.2% |
| Scotch-Irish | 62.6 /100 | #156 | Good 12.2% |
| Costa Ricans | 62.2 /100 | #157 | Good 12.2% |
| Taiwanese | 61.8 /100 | #158 | Good 12.2% |