Slovene vs Immigrants from Chile Single Female Poverty
COMPARE
Slovene
Immigrants from Chile
Single Female Poverty
Single Female Poverty Comparison
Slovenes
Immigrants from Chile
20.3%
SINGLE FEMALE POVERTY
90.5/ 100
METRIC RATING
138th/ 347
METRIC RANK
20.1%
SINGLE FEMALE POVERTY
94.3/ 100
METRIC RATING
124th/ 347
METRIC RANK
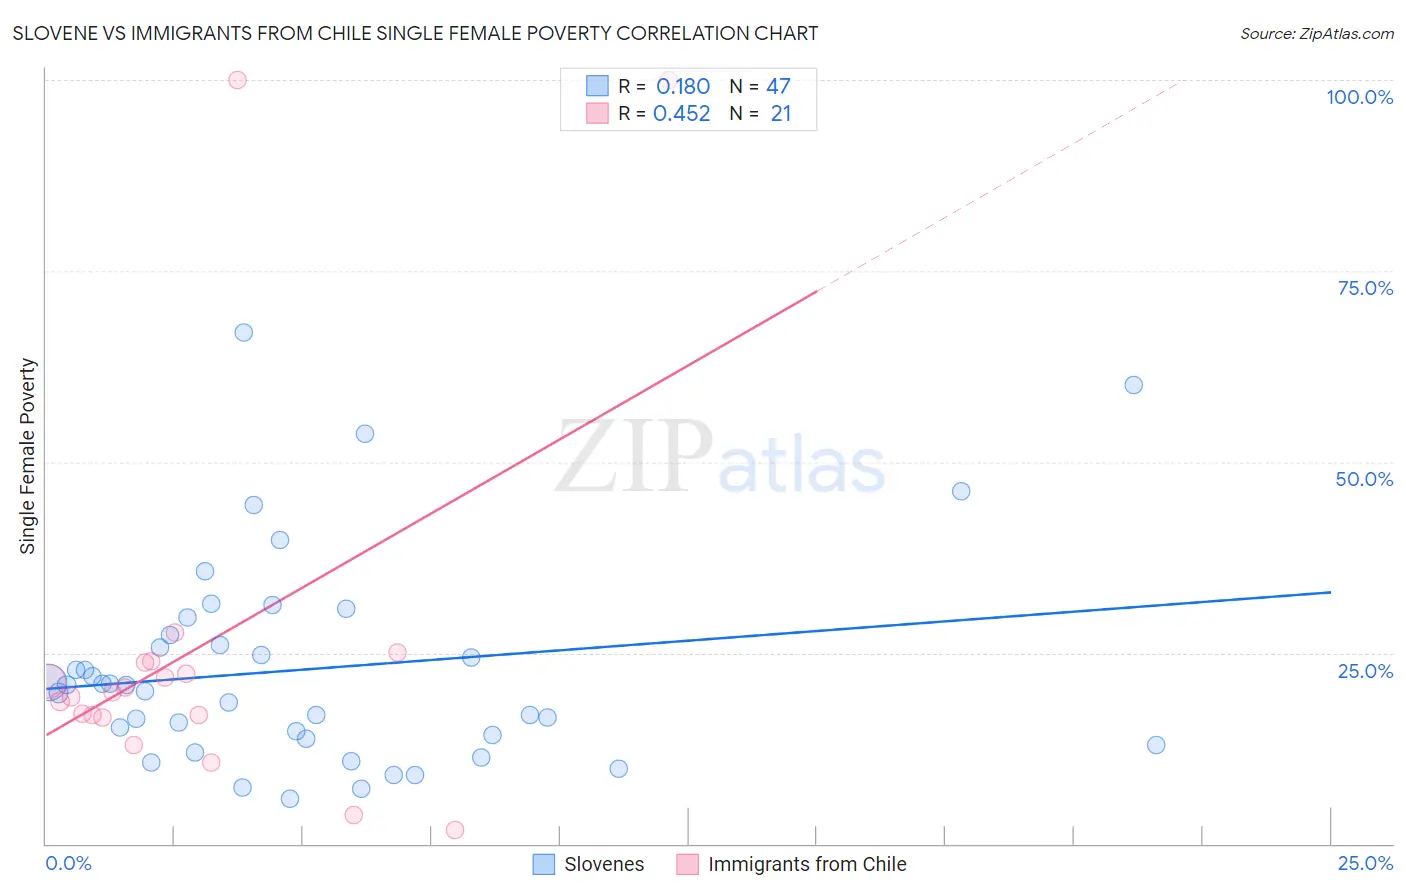
Slovene vs Immigrants from Chile Single Female Poverty Correlation Chart
The statistical analysis conducted on geographies consisting of 257,900,549 people shows a poor positive correlation between the proportion of Slovenes and poverty level among single females in the United States with a correlation coefficient (R) of 0.180 and weighted average of 20.3%. Similarly, the statistical analysis conducted on geographies consisting of 216,927,645 people shows a moderate positive correlation between the proportion of Immigrants from Chile and poverty level among single females in the United States with a correlation coefficient (R) of 0.452 and weighted average of 20.1%, a difference of 0.92%.
Single Female Poverty Correlation Summary
| Measurement | Slovene | Immigrants from Chile |
| Minimum | 5.9% | 1.8% |
| Maximum | 67.0% | 100.0% |
| Range | 61.1% | 98.2% |
| Mean | 22.9% | 25.7% |
| Median | 20.8% | 19.7% |
| Interquartile 25% (IQ1) | 13.8% | 16.7% |
| Interquartile 75% (IQ3) | 27.3% | 23.8% |
| Interquartile Range (IQR) | 13.5% | 7.1% |
| Standard Deviation (Sample) | 13.6% | 25.5% |
| Standard Deviation (Population) | 13.5% | 24.9% |
Demographics Similar to Slovenes and Immigrants from Chile by Single Female Poverty
In terms of single female poverty, the demographic groups most similar to Slovenes are Immigrants from Kuwait (20.3%, a difference of 0.010%), Syrian (20.3%, a difference of 0.010%), Immigrants from Nepal (20.3%, a difference of 0.030%), Immigrants from Canada (20.2%, a difference of 0.14%), and Immigrants from Iraq (20.2%, a difference of 0.15%). Similarly, the demographic groups most similar to Immigrants from Chile are Brazilian (20.1%, a difference of 0.030%), Immigrants from South Africa (20.1%, a difference of 0.12%), Immigrants from South America (20.0%, a difference of 0.20%), Immigrants from Switzerland (20.0%, a difference of 0.24%), and Serbian (20.1%, a difference of 0.30%).
| Demographics | Rating | Rank | Single Female Poverty |
| Immigrants | Switzerland | 95.1 /100 | #121 | Exceptional 20.0% |
| Immigrants | South America | 95.0 /100 | #122 | Exceptional 20.0% |
| Brazilians | 94.4 /100 | #123 | Exceptional 20.1% |
| Immigrants | Chile | 94.3 /100 | #124 | Exceptional 20.1% |
| Immigrants | South Africa | 93.9 /100 | #125 | Exceptional 20.1% |
| Serbians | 93.3 /100 | #126 | Exceptional 20.1% |
| Mongolians | 93.2 /100 | #127 | Exceptional 20.2% |
| Immigrants | Spain | 92.7 /100 | #128 | Exceptional 20.2% |
| Immigrants | Morocco | 92.4 /100 | #129 | Exceptional 20.2% |
| Immigrants | Hungary | 92.3 /100 | #130 | Exceptional 20.2% |
| Pakistanis | 92.1 /100 | #131 | Exceptional 20.2% |
| Uruguayans | 92.1 /100 | #132 | Exceptional 20.2% |
| Immigrants | England | 91.9 /100 | #133 | Exceptional 20.2% |
| Immigrants | Venezuela | 91.5 /100 | #134 | Exceptional 20.2% |
| Immigrants | Iraq | 91.2 /100 | #135 | Exceptional 20.2% |
| Immigrants | Canada | 91.2 /100 | #136 | Exceptional 20.2% |
| Immigrants | Nepal | 90.6 /100 | #137 | Exceptional 20.3% |
| Slovenes | 90.5 /100 | #138 | Exceptional 20.3% |
| Immigrants | Kuwait | 90.4 /100 | #139 | Exceptional 20.3% |
| Syrians | 90.4 /100 | #140 | Exceptional 20.3% |
| Immigrants | North America | 89.5 /100 | #141 | Excellent 20.3% |